Excel
Turn an Excel workbook into a full Navi dashboard.
Navi creates the workbook structure, checks it before loading and turns the completed records into the same connected dashboard experience used with database information.
The complete Excel journey
A clear path from Excel to Navi.
These are the actual screens used from the first setup through to the working dashboard.
Step 1
Create a place for the workbook.
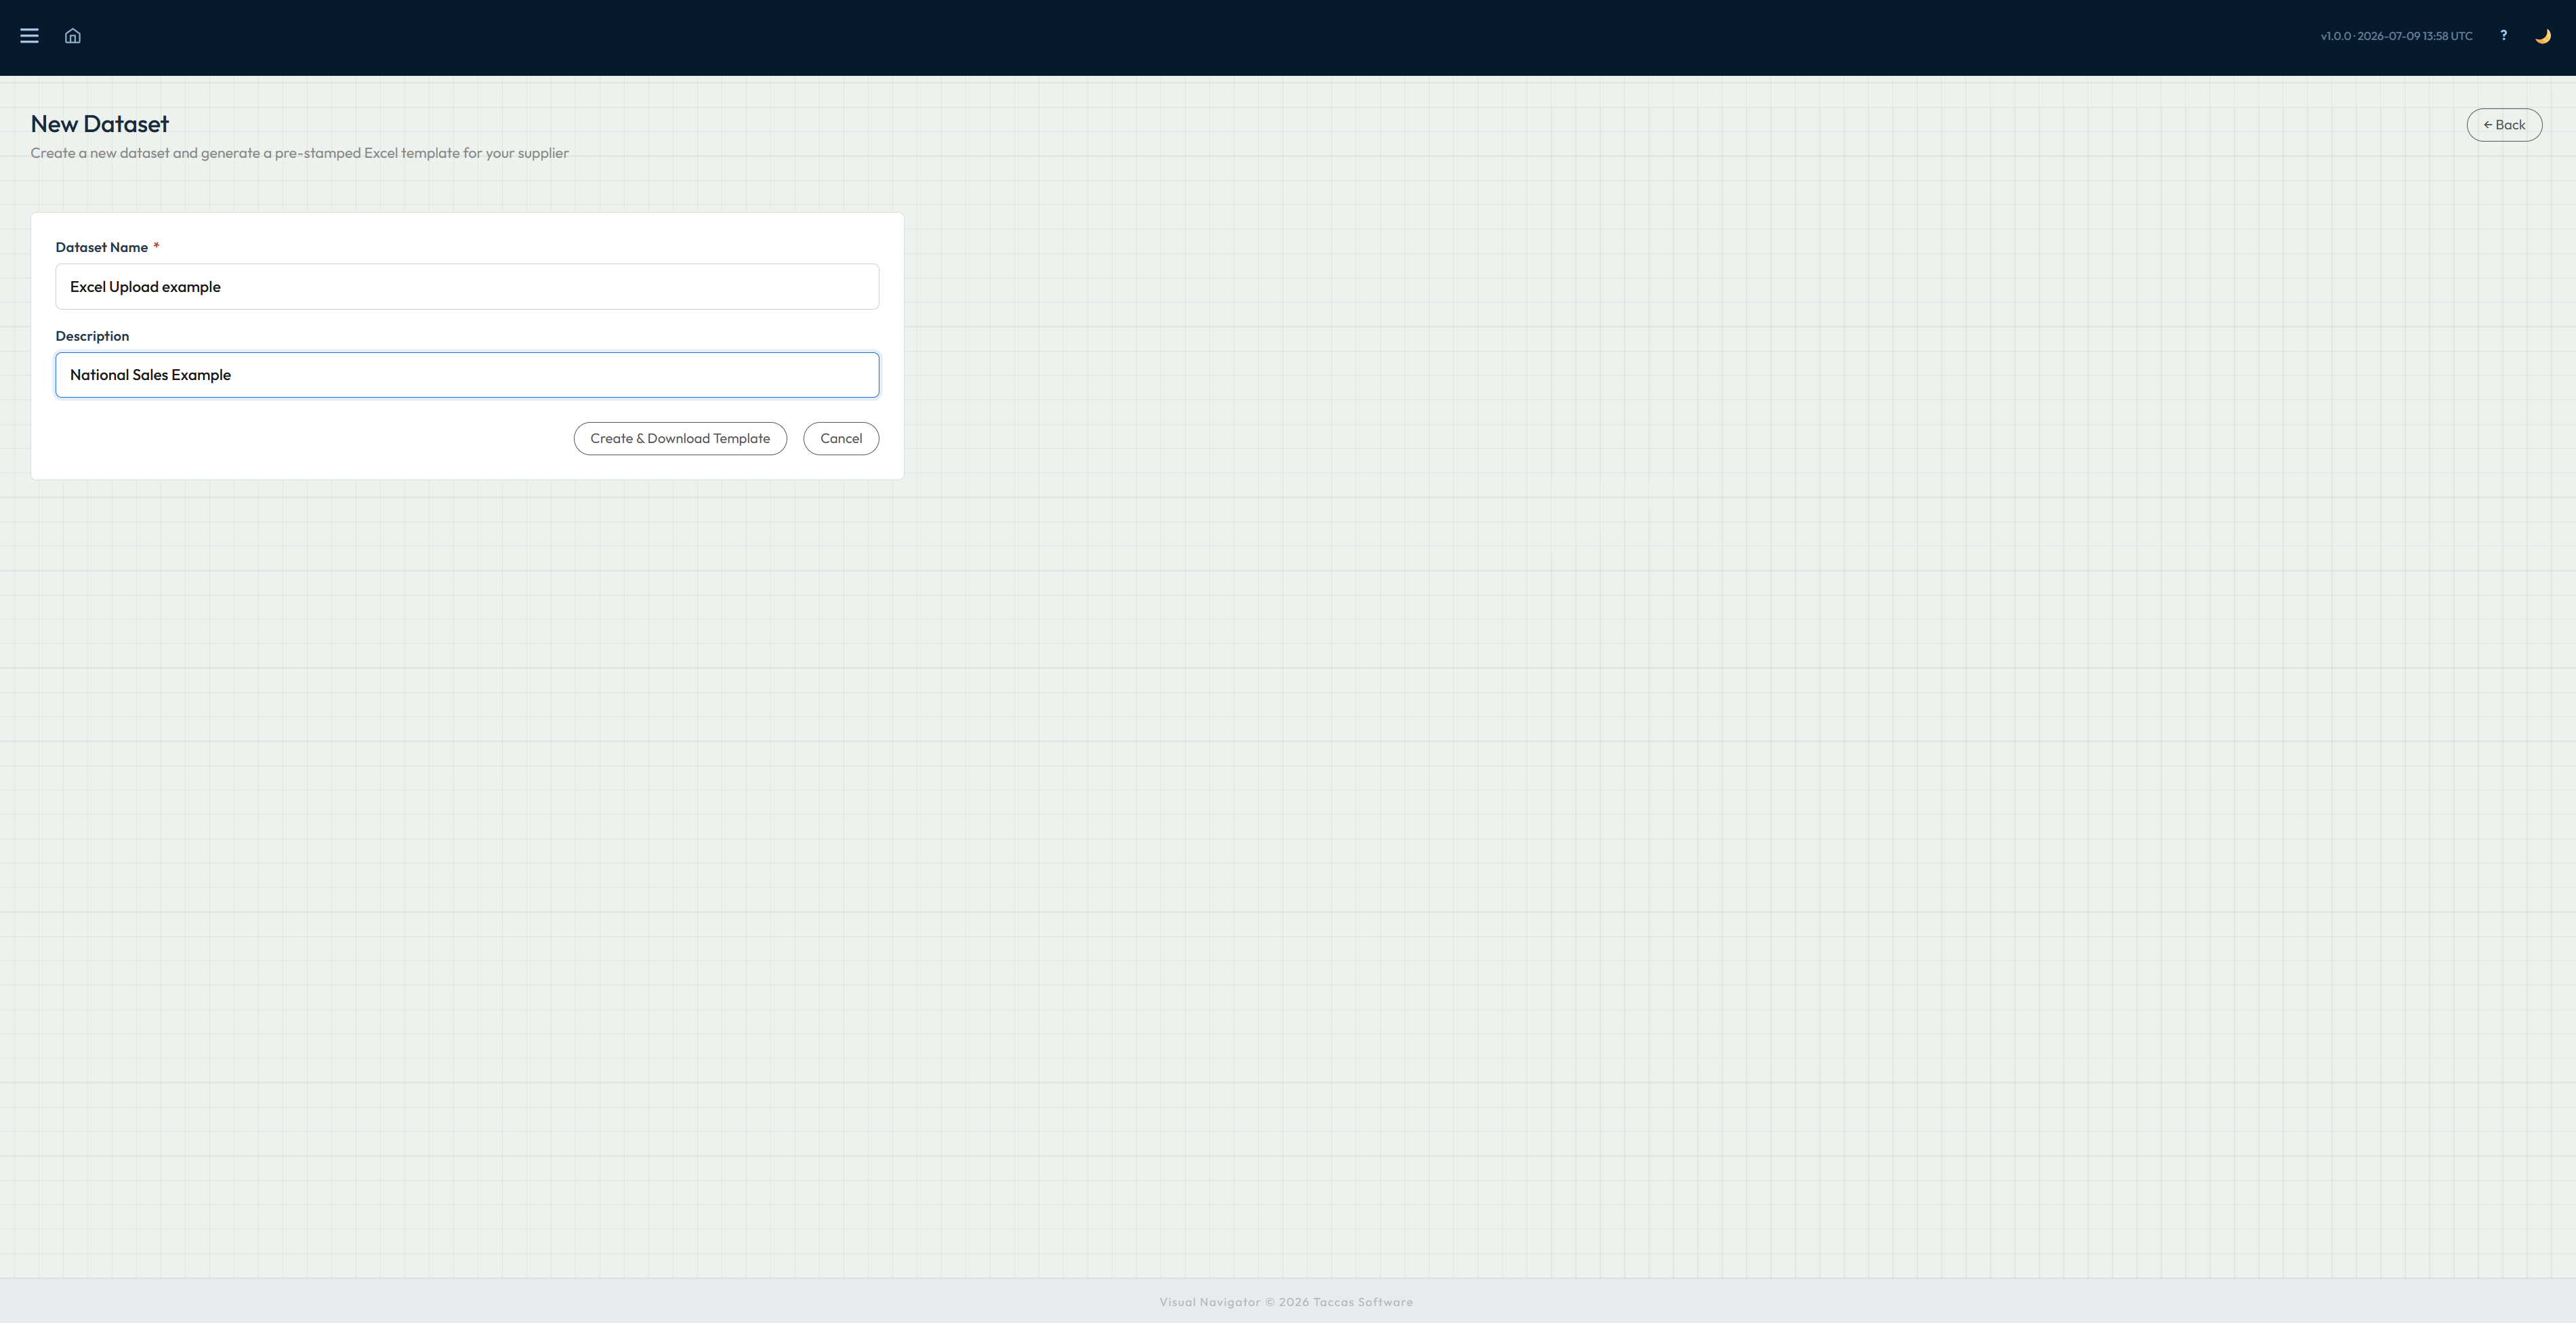
Open Data Loads and select New Dataset. Enter a name people will recognise and a short description of the information the workbook will contain.
Select Create & Download Template. This gives the load its own identity in Navi and ties the workbook that is about to be created to the right place.
Step 2
Download the workbook Navi creates.
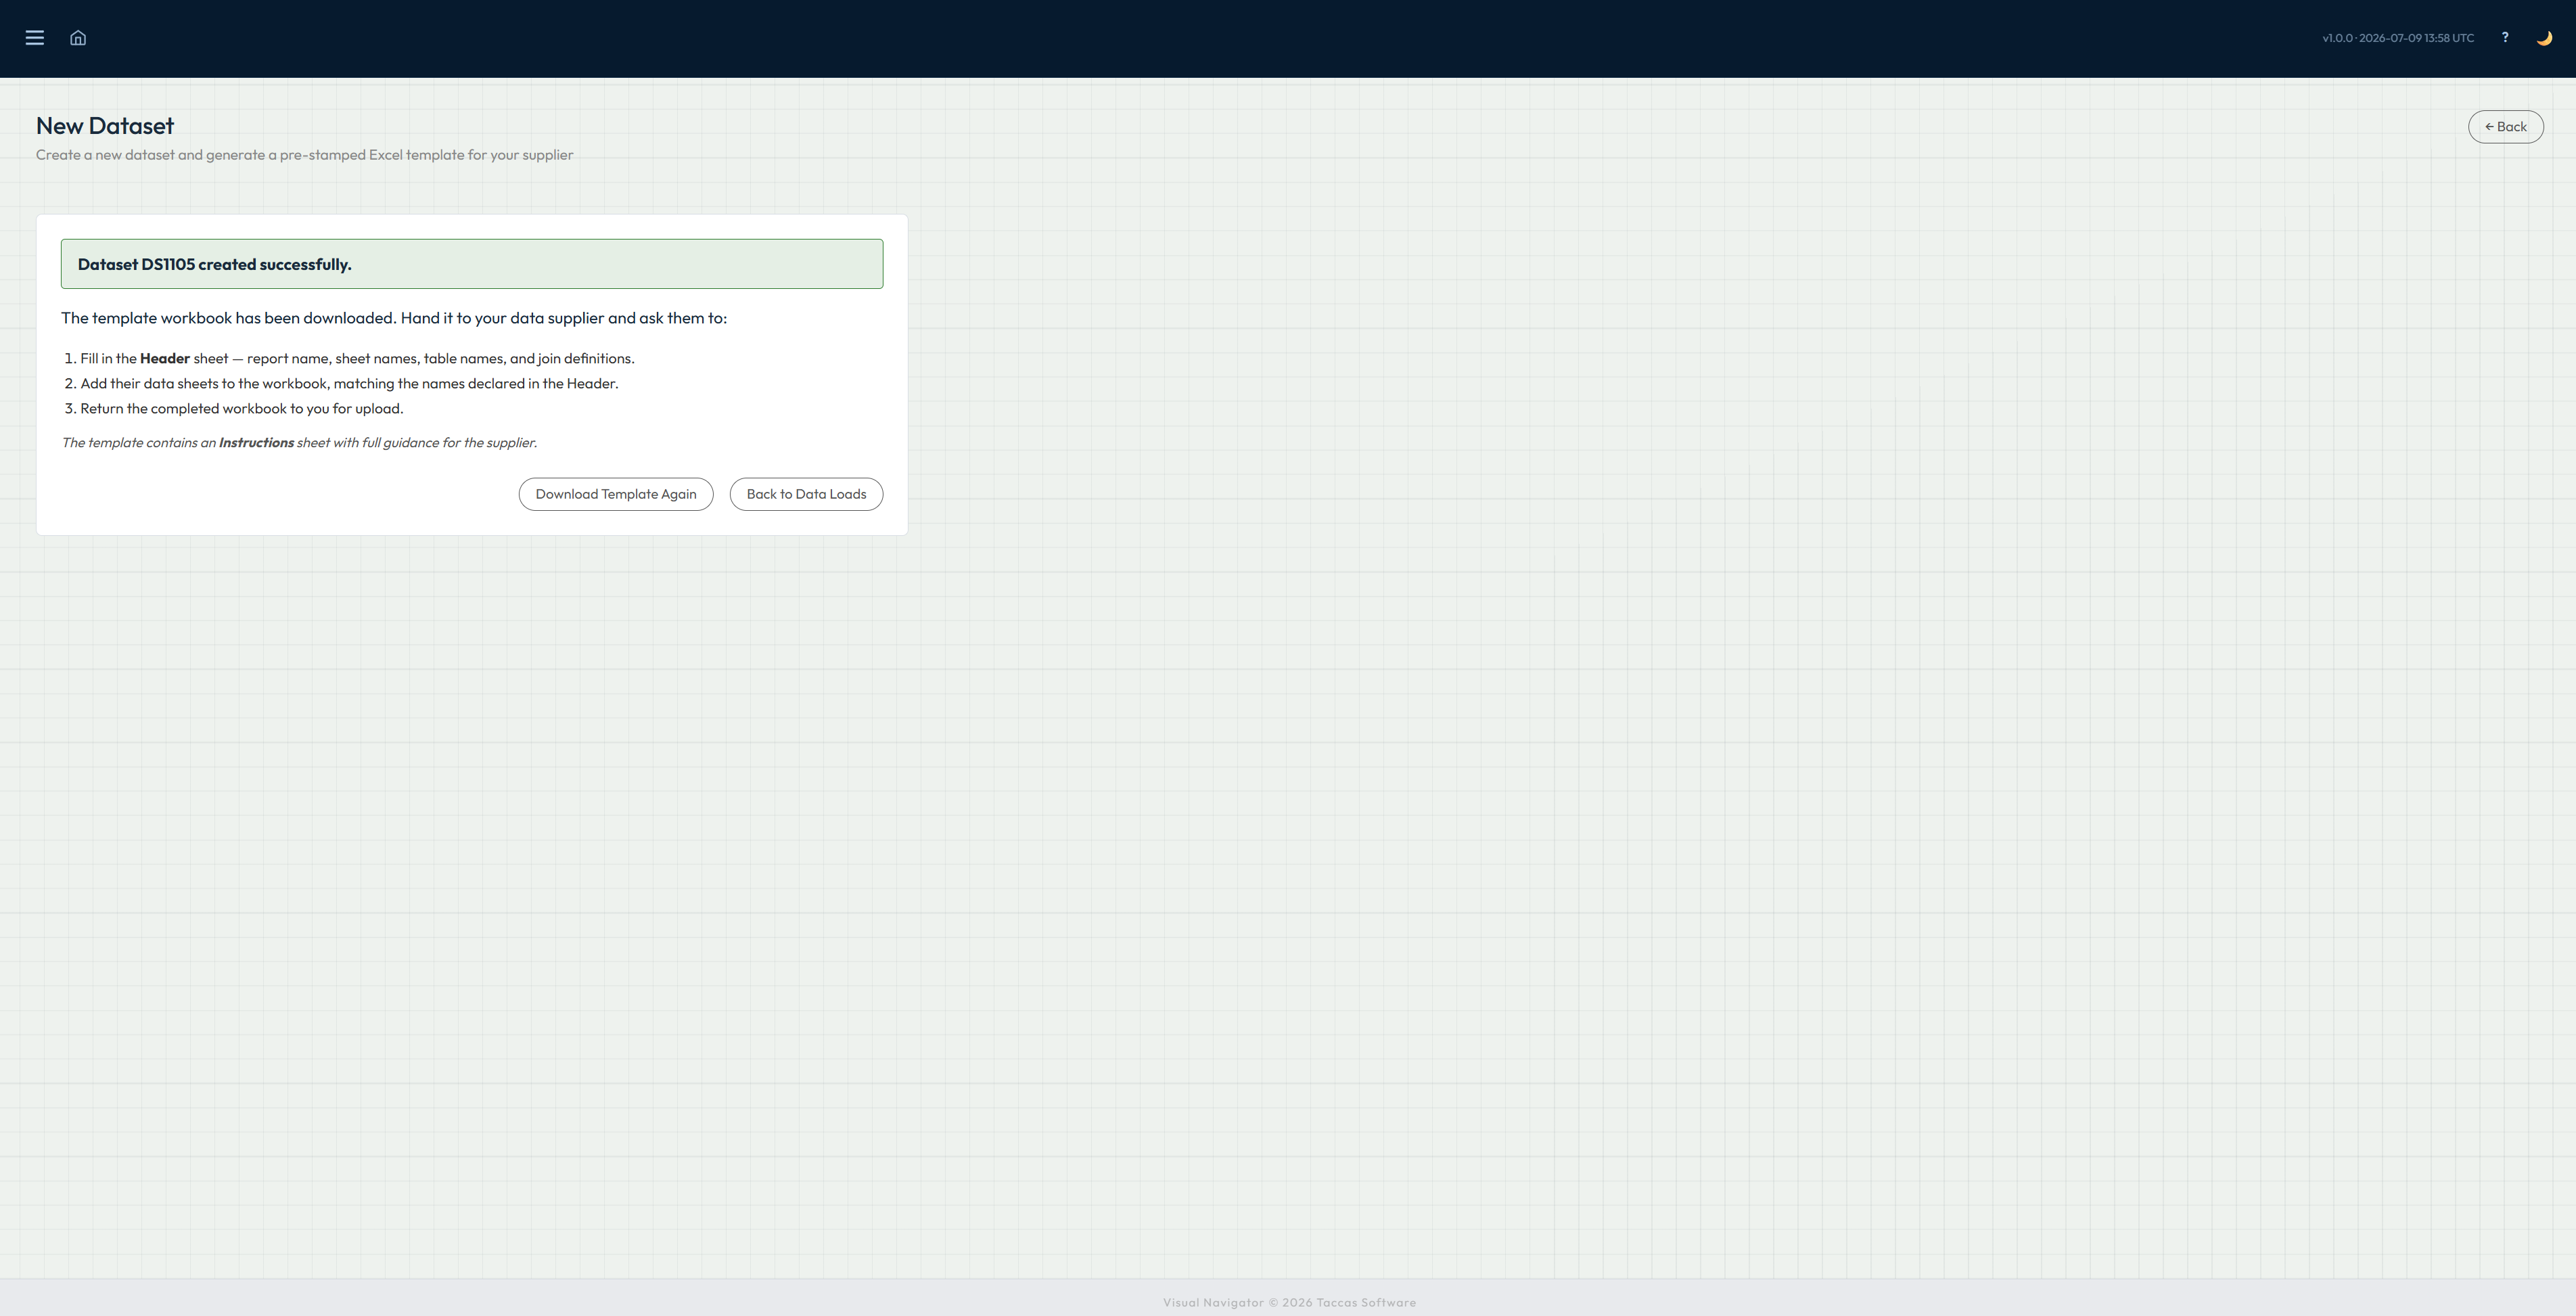
Navi confirms that the new collection has been created and downloads a workbook stamped with its unique reference. That reference tells Navi which collection the workbook belongs to when it comes back.
The confirmation screen also explains what needs to be completed. The workbook includes an Instructions sheet, so the person filling it in has the guidance beside the data rather than having to recreate the format from memory.
Step 3
Describe the sheets and how they connect.
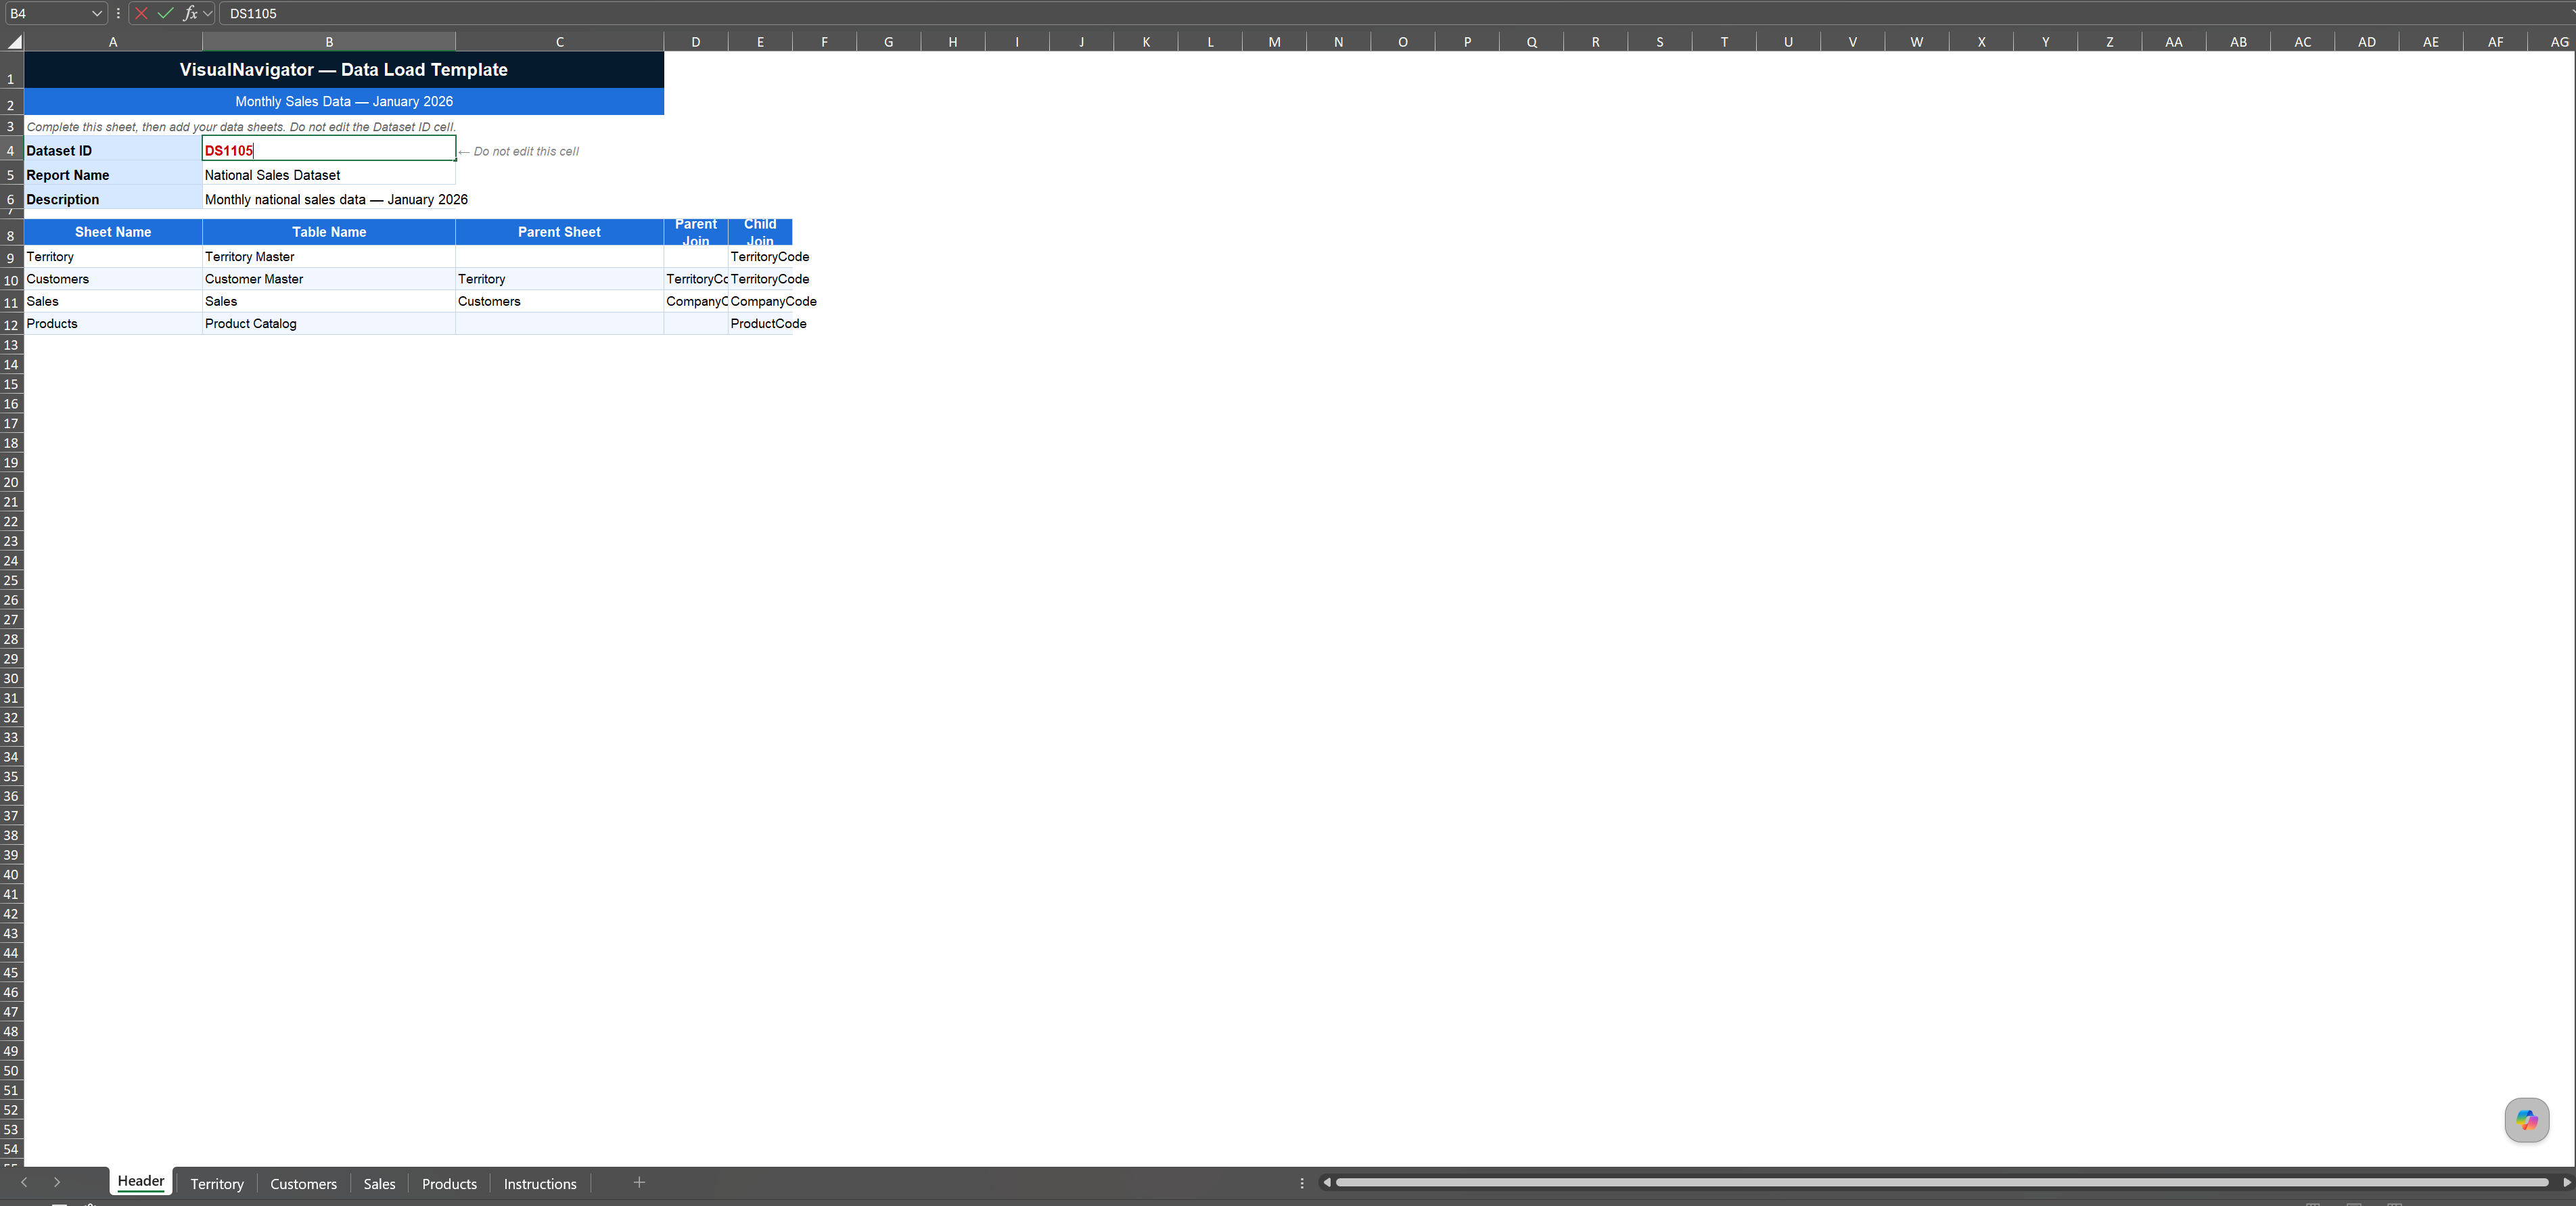
On the workbook's Header sheet, enter the report name and list each data sheet. Where one sheet belongs beneath another, identify the matching columns. In this sales example, customers belong to territories and sales belong to customers.
This small map lets Navi keep those relationships when people move from a summary to the records behind it. The workbook already supplies the headings and examples needed to complete it.
Step 4
Fill the workbook in Excel.
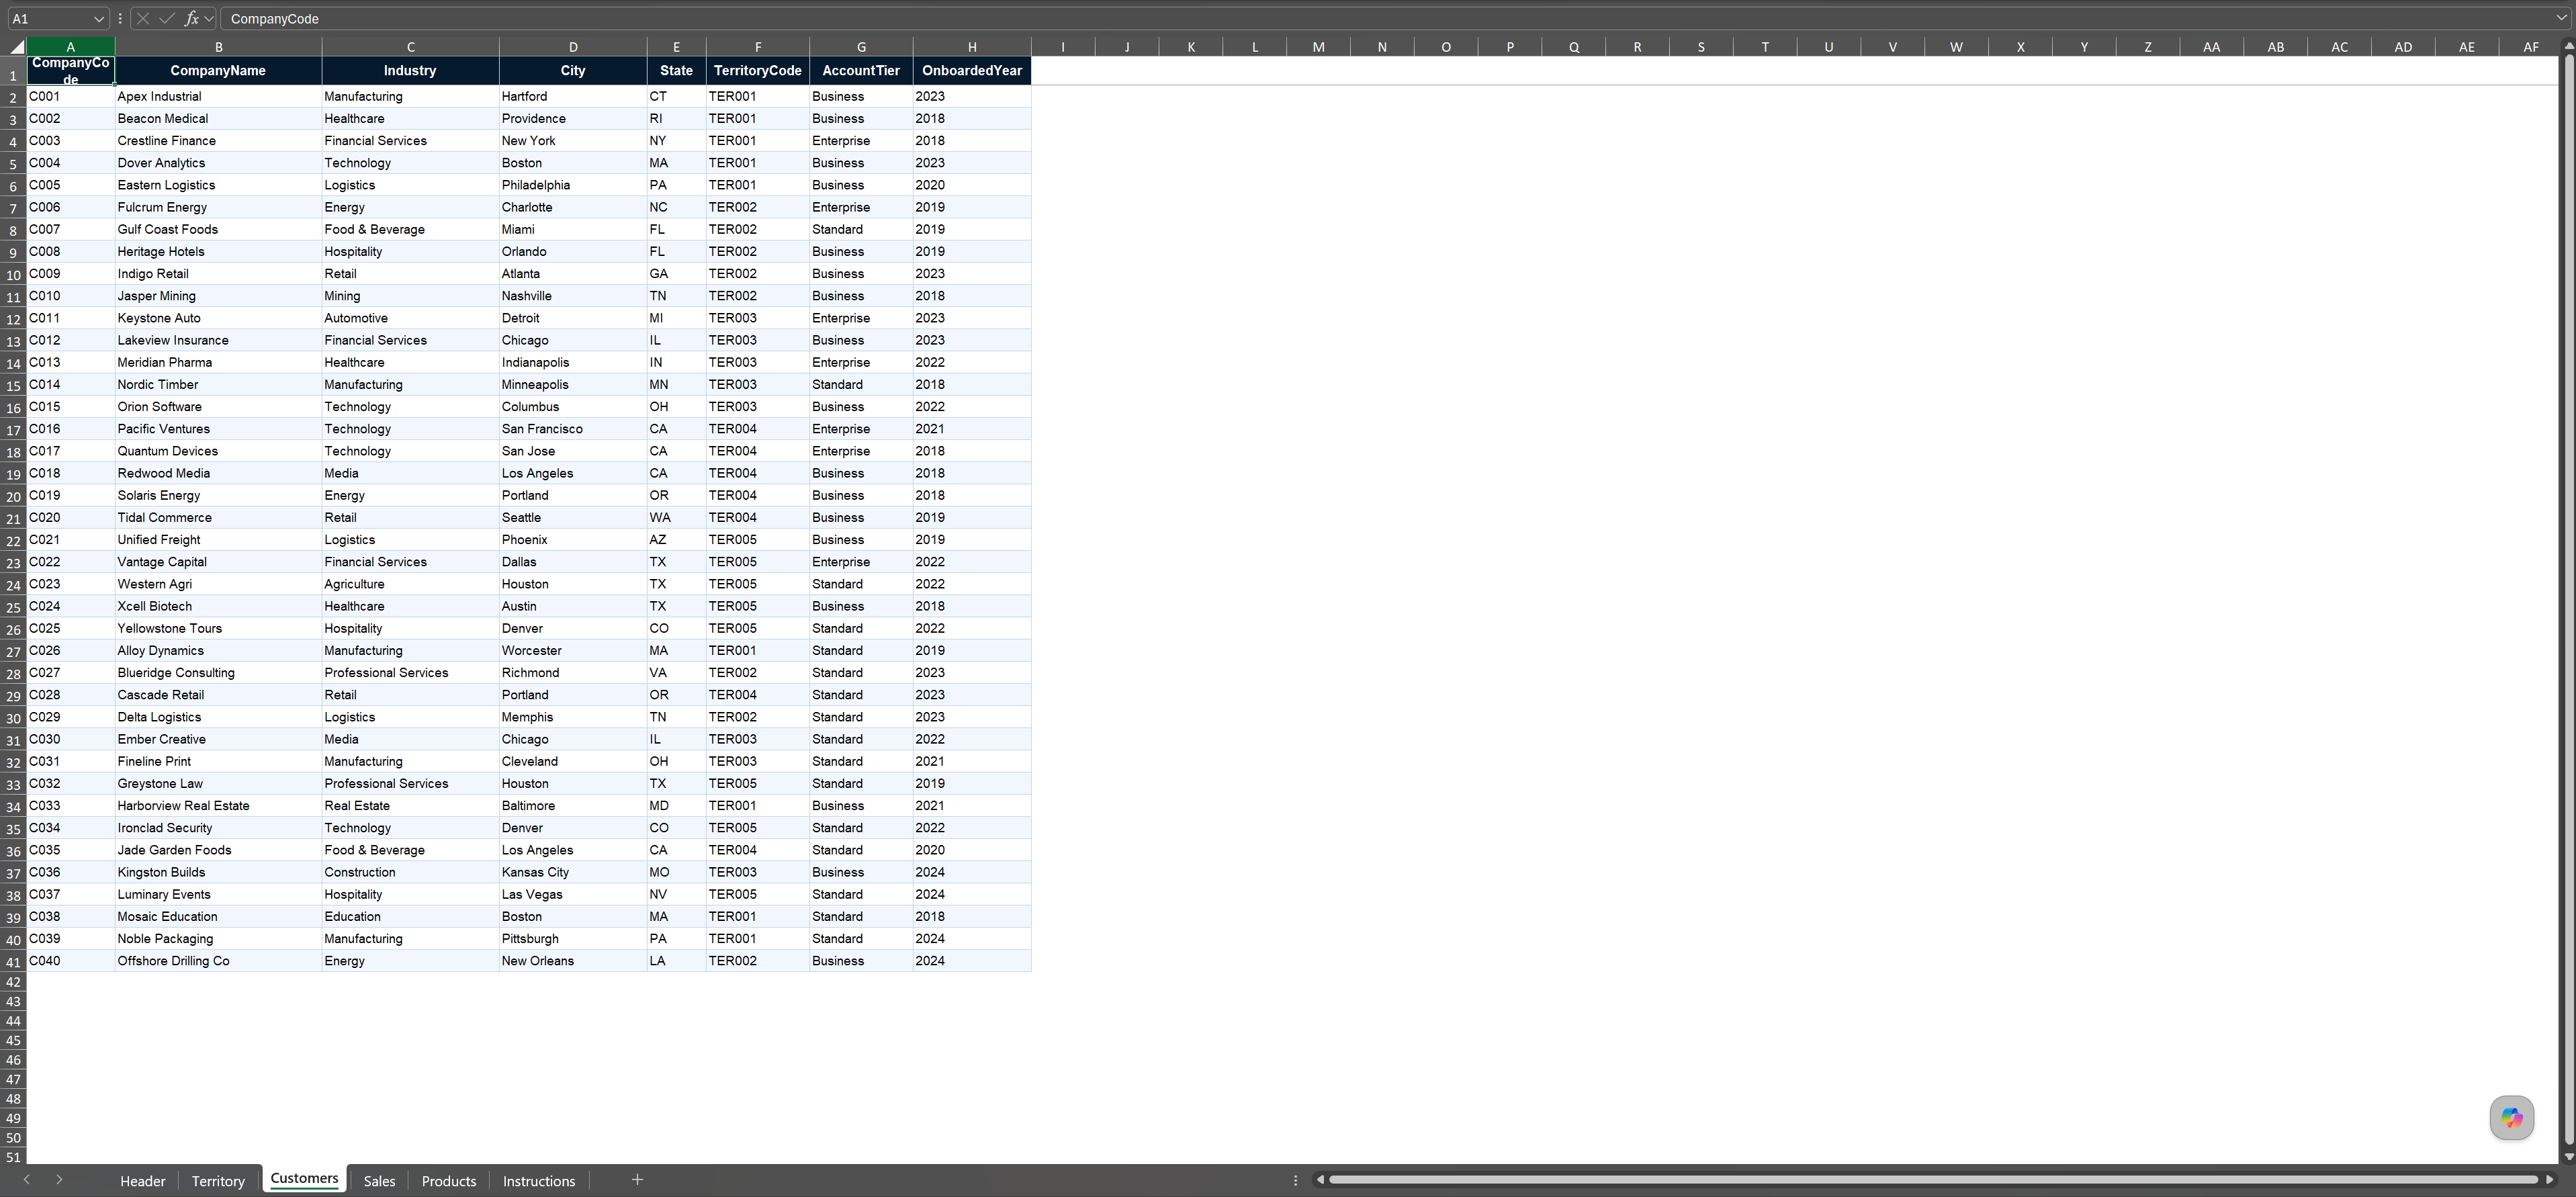
Add the team's records to the named sheets. Each row is one record and each column holds one kind of information, such as customer name, industry, city or territory code.
Teams can prepare and check the information in Excel using familiar sorting, filtering and editing tools. The sheet names and matching codes entered on the Header sheet keep the different groups of records connected.
Step 5
Upload the completed workbook.
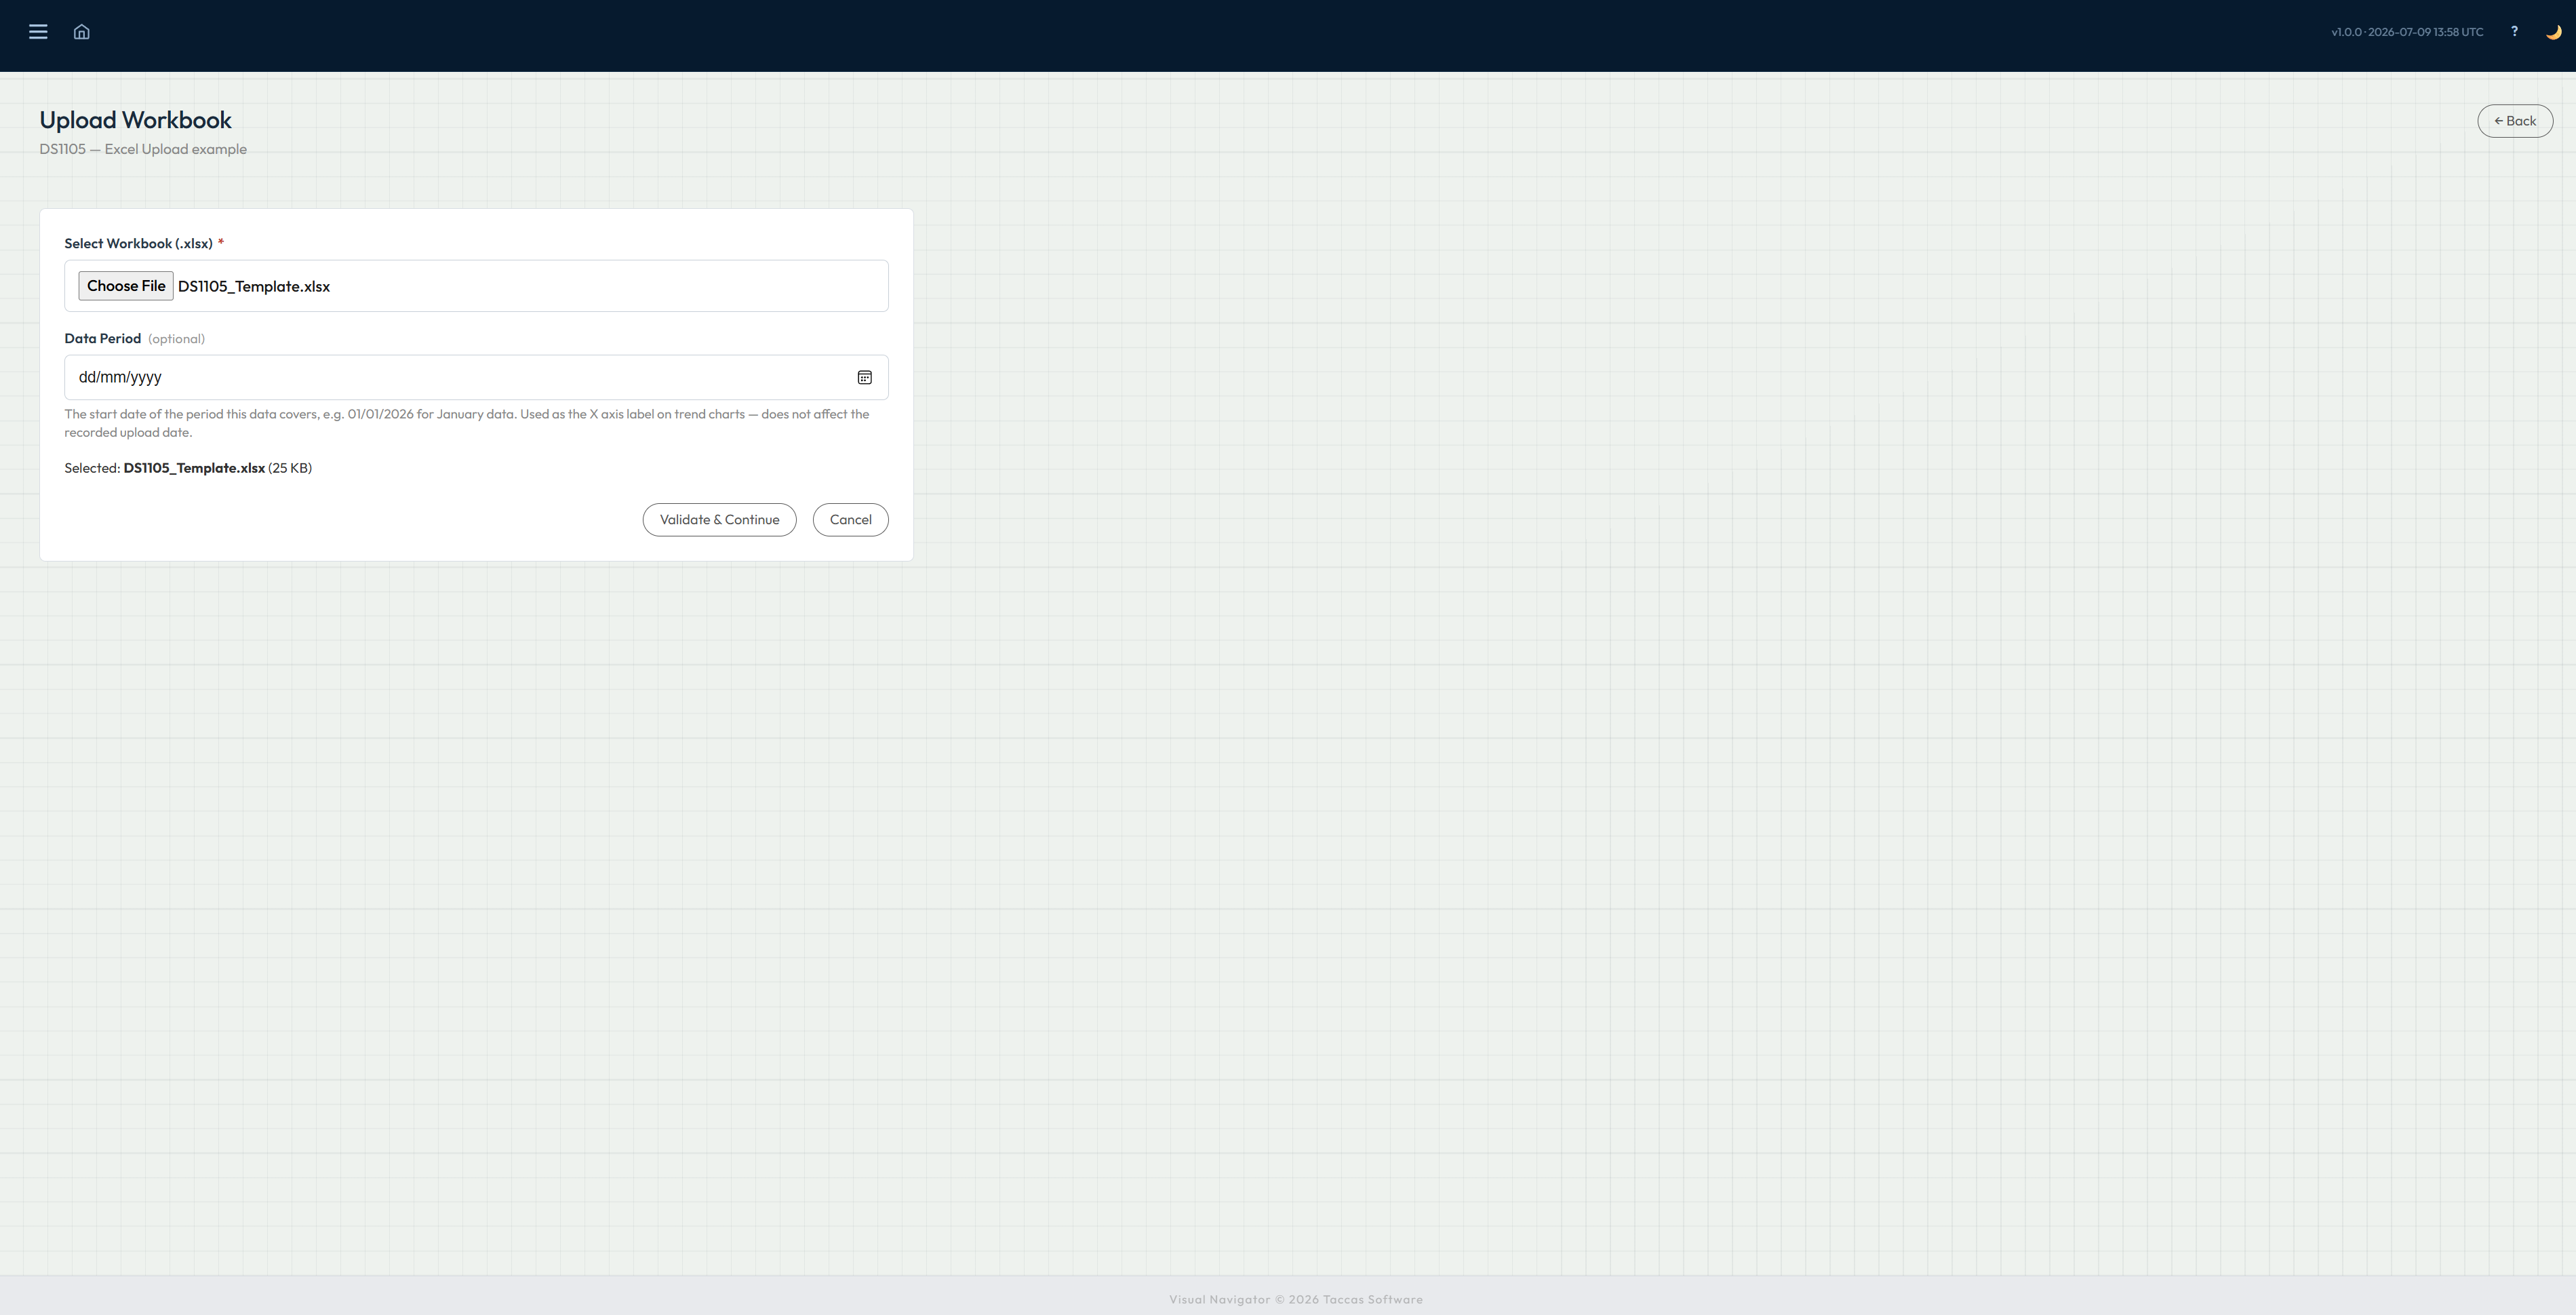
Return to the collection in Data Loads and select Upload. Choose the completed workbook, add the date represented by the records and select Validate & Continue.
The date gives this load a clear place in time. It also allows later loads to form a history that people can compare.
Step 6
Correct structural problems before loading.
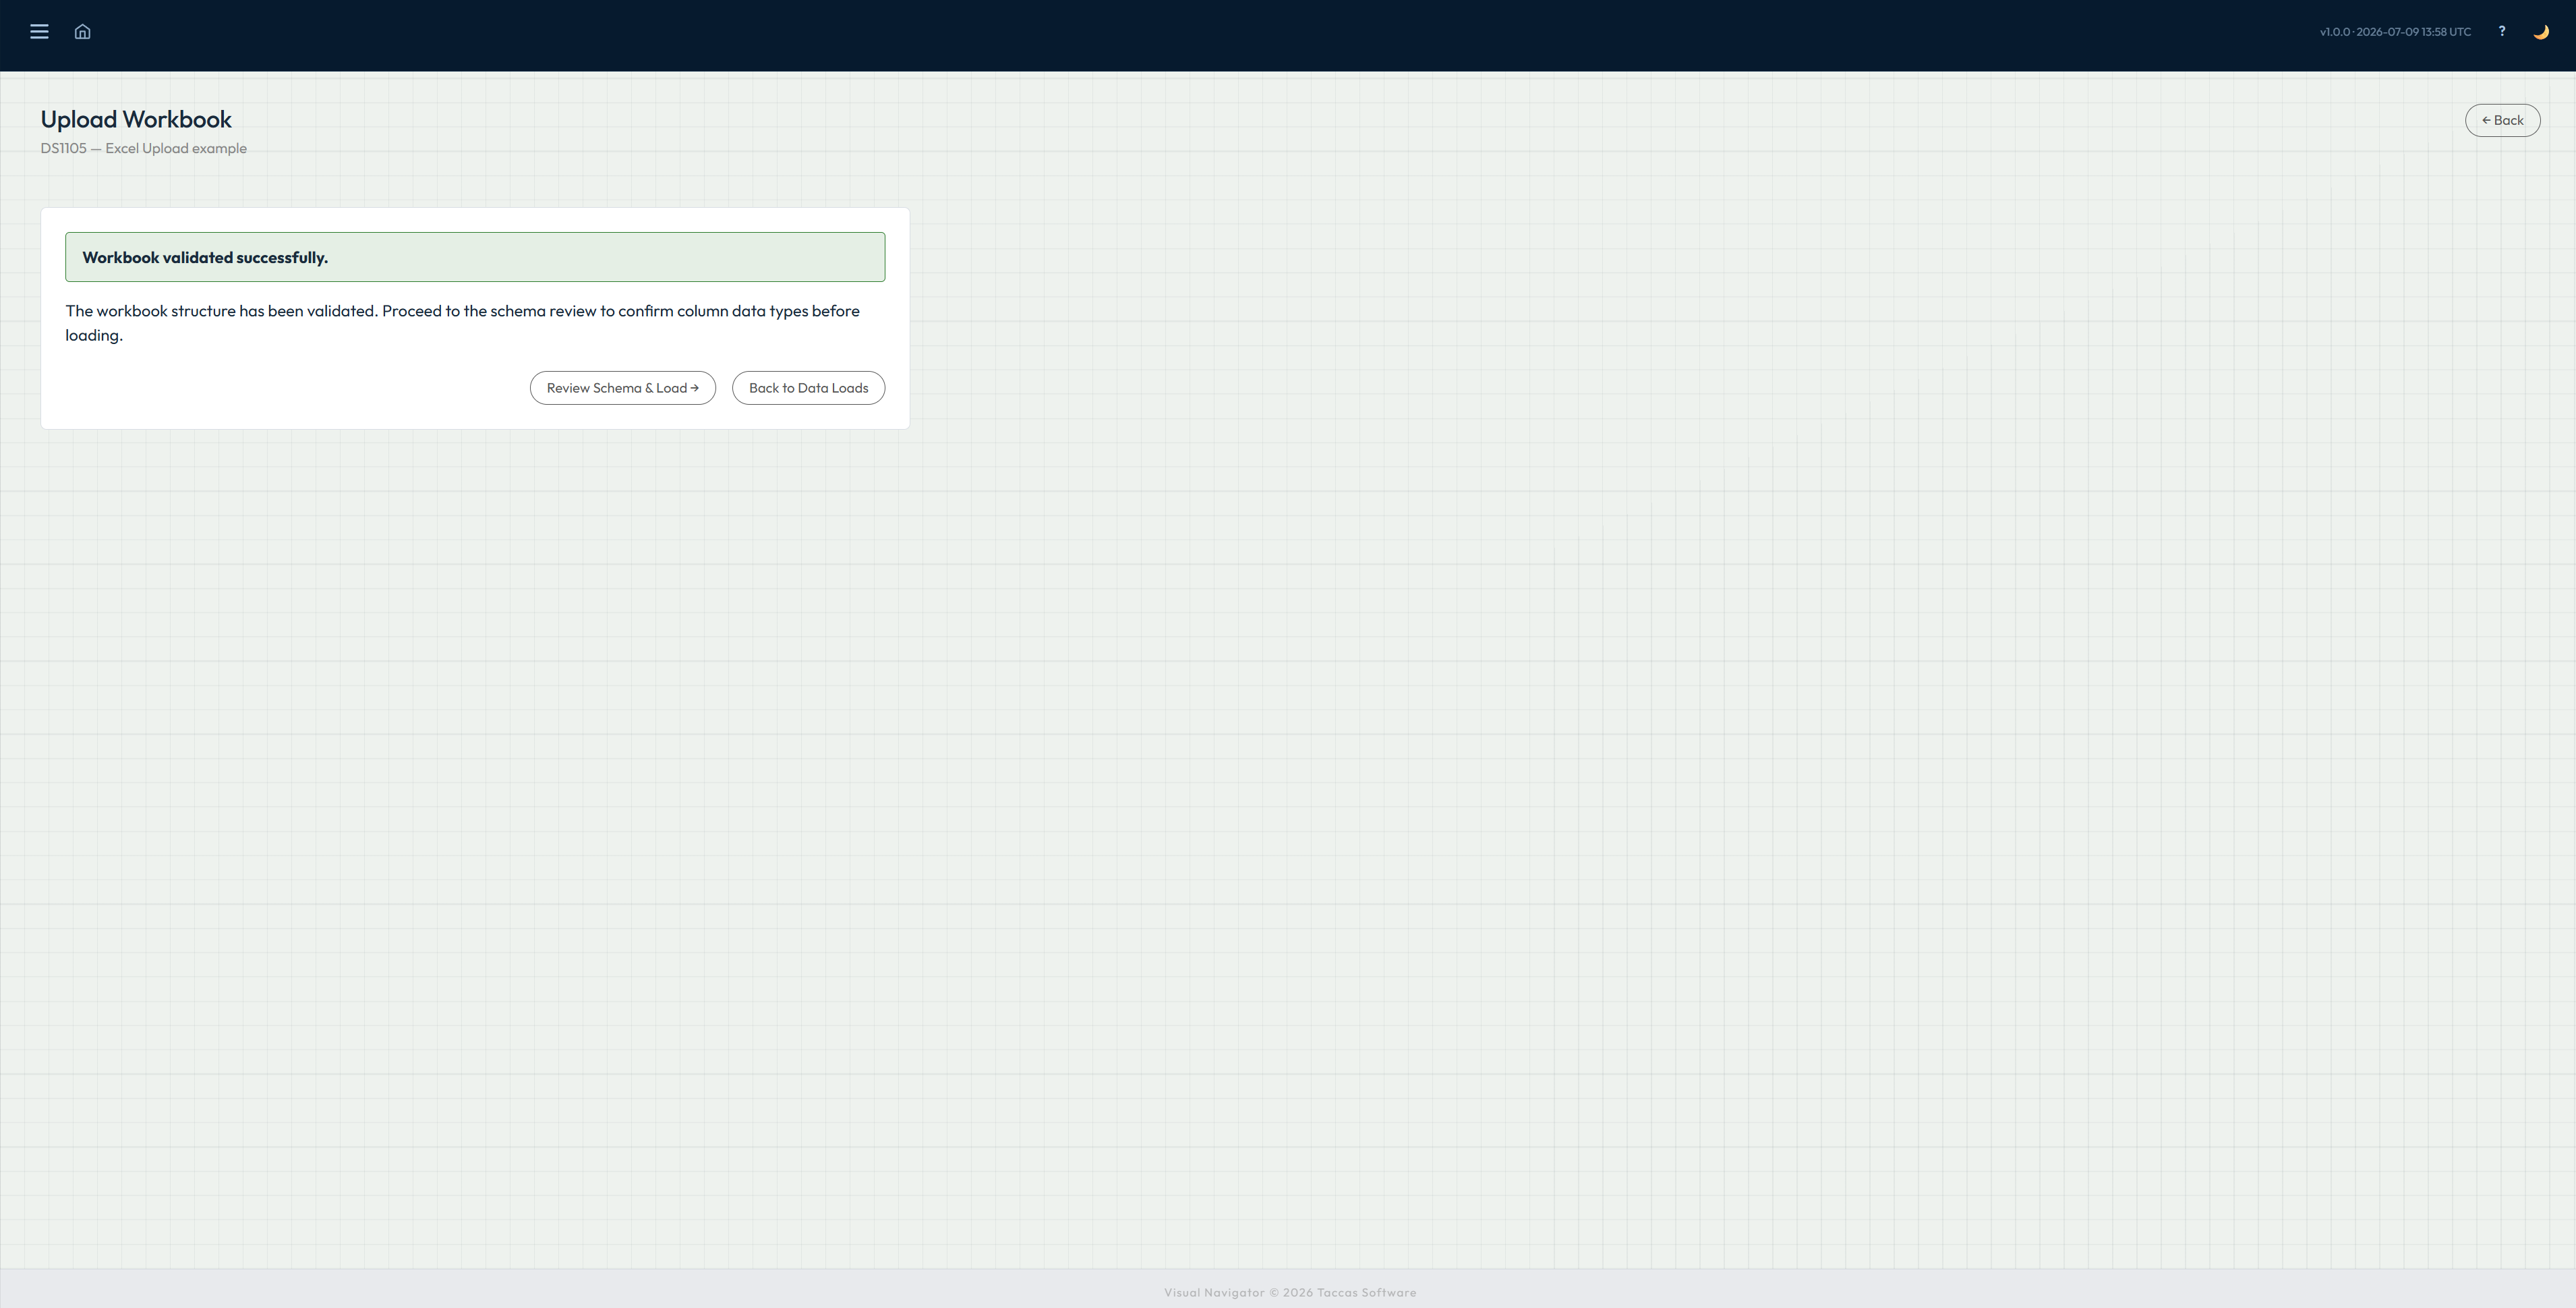
Navi checks the workbook's sheets, headings and connections before loading any records. If something is missing or arranged incorrectly, it can be corrected in Excel while the source is still easy to inspect.
When the workbook passes, Navi displays Workbook validated successfully. Select Review Schema & Load to continue to the final check.
Step 7
Check how every column will be treated.
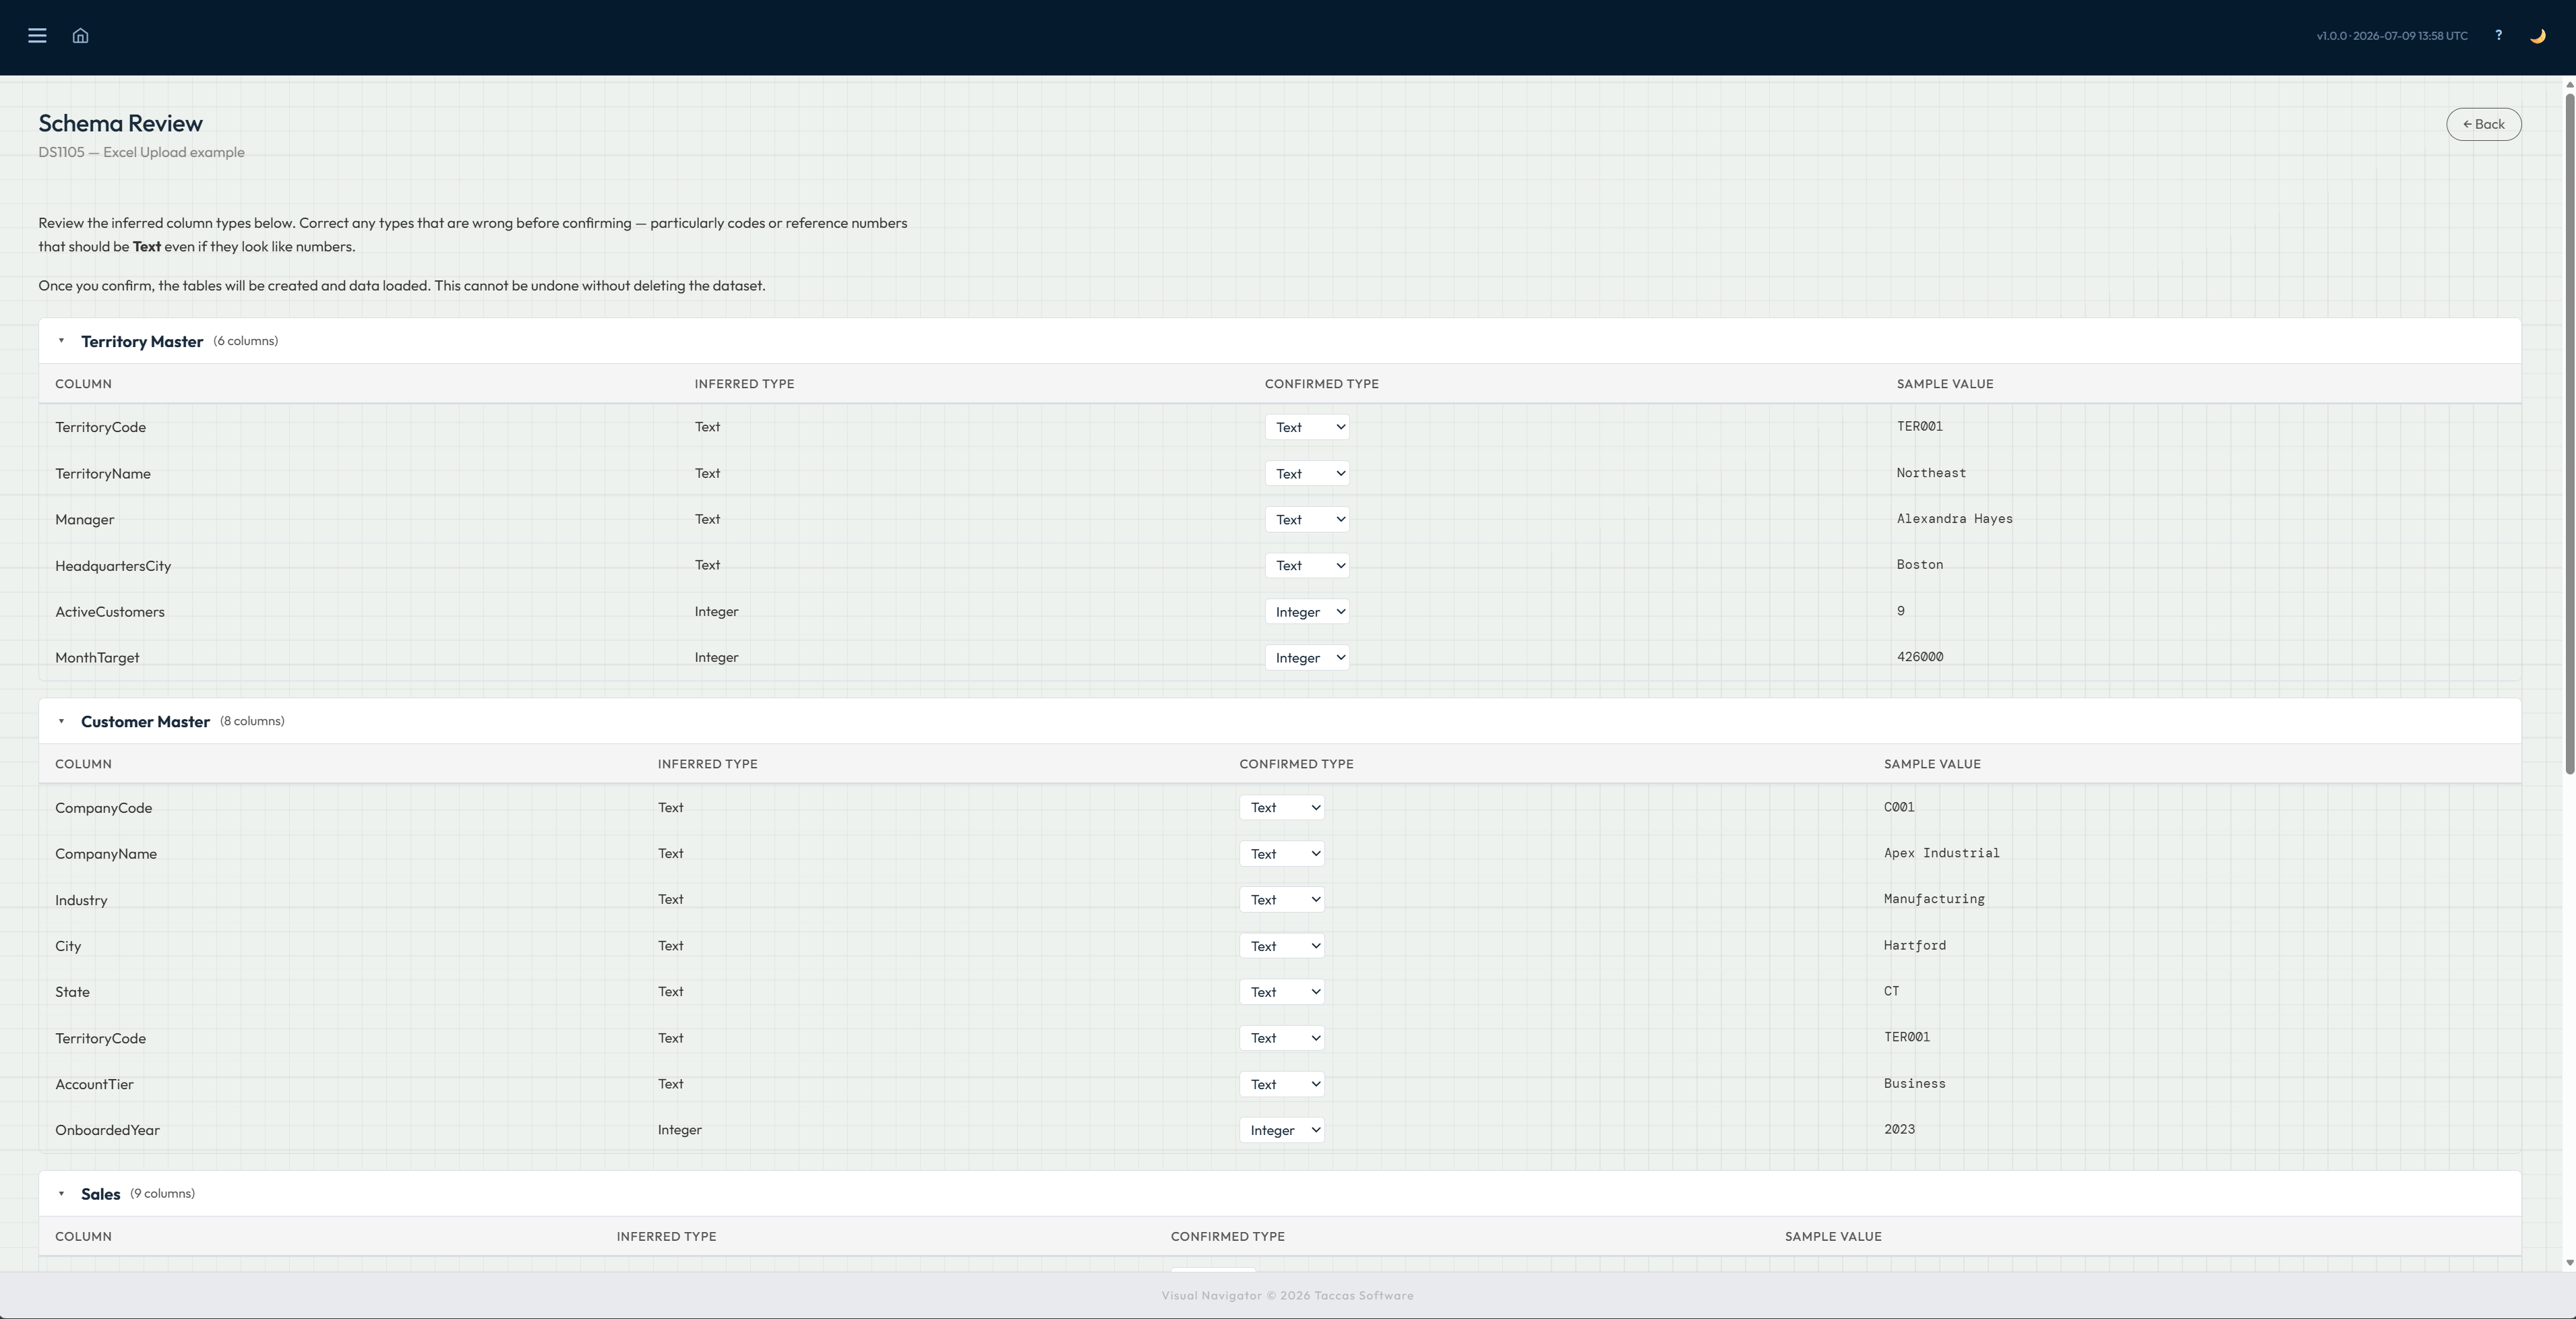
Navi shows each sheet and column together with a sample value. Check whether each column should be treated as text, a whole number, a decimal number or a date, and change any choice that is wrong.
This matters for codes that contain only digits but are still labels, and for dates or amounts that need to sort and calculate correctly. Nothing is loaded until this review is confirmed.
Step 8
Load the checked records.
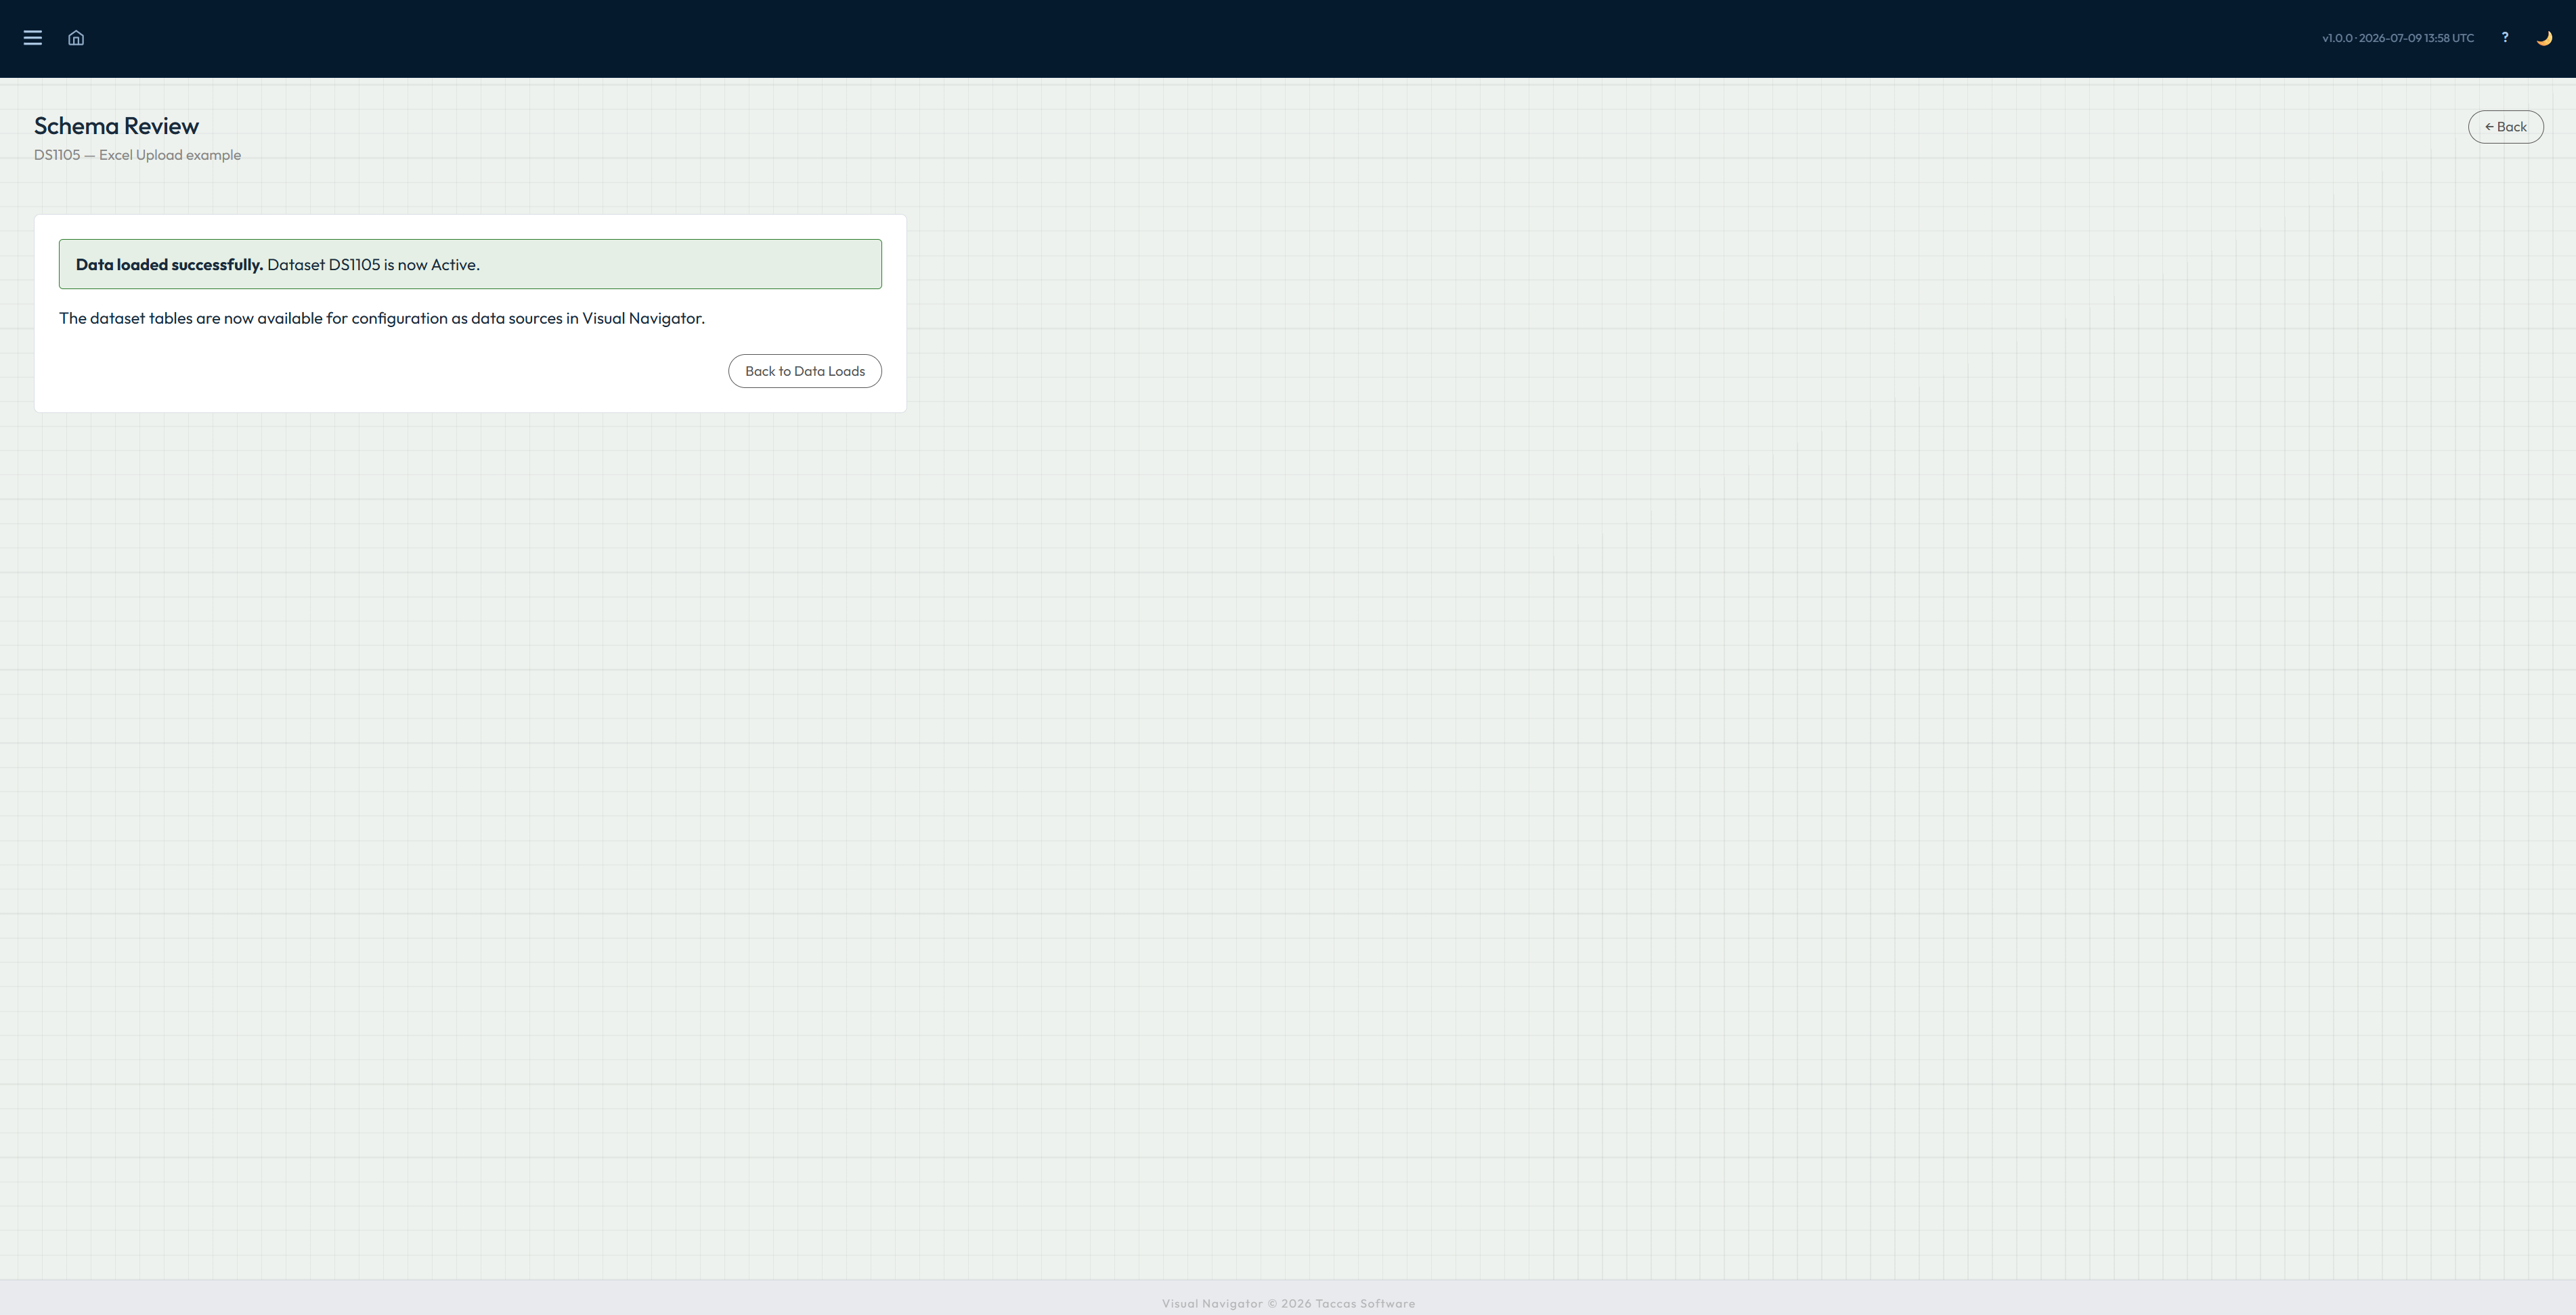
After reviewing all of the sheets, select Confirm & Load Data. Navi creates the collection from the workbook and confirms that the load completed successfully.
The collection is now active and ready to be used when the dashboard is arranged. The confirmation removes any uncertainty about whether the records were accepted.
Step 9
Use the full Navi dashboard.
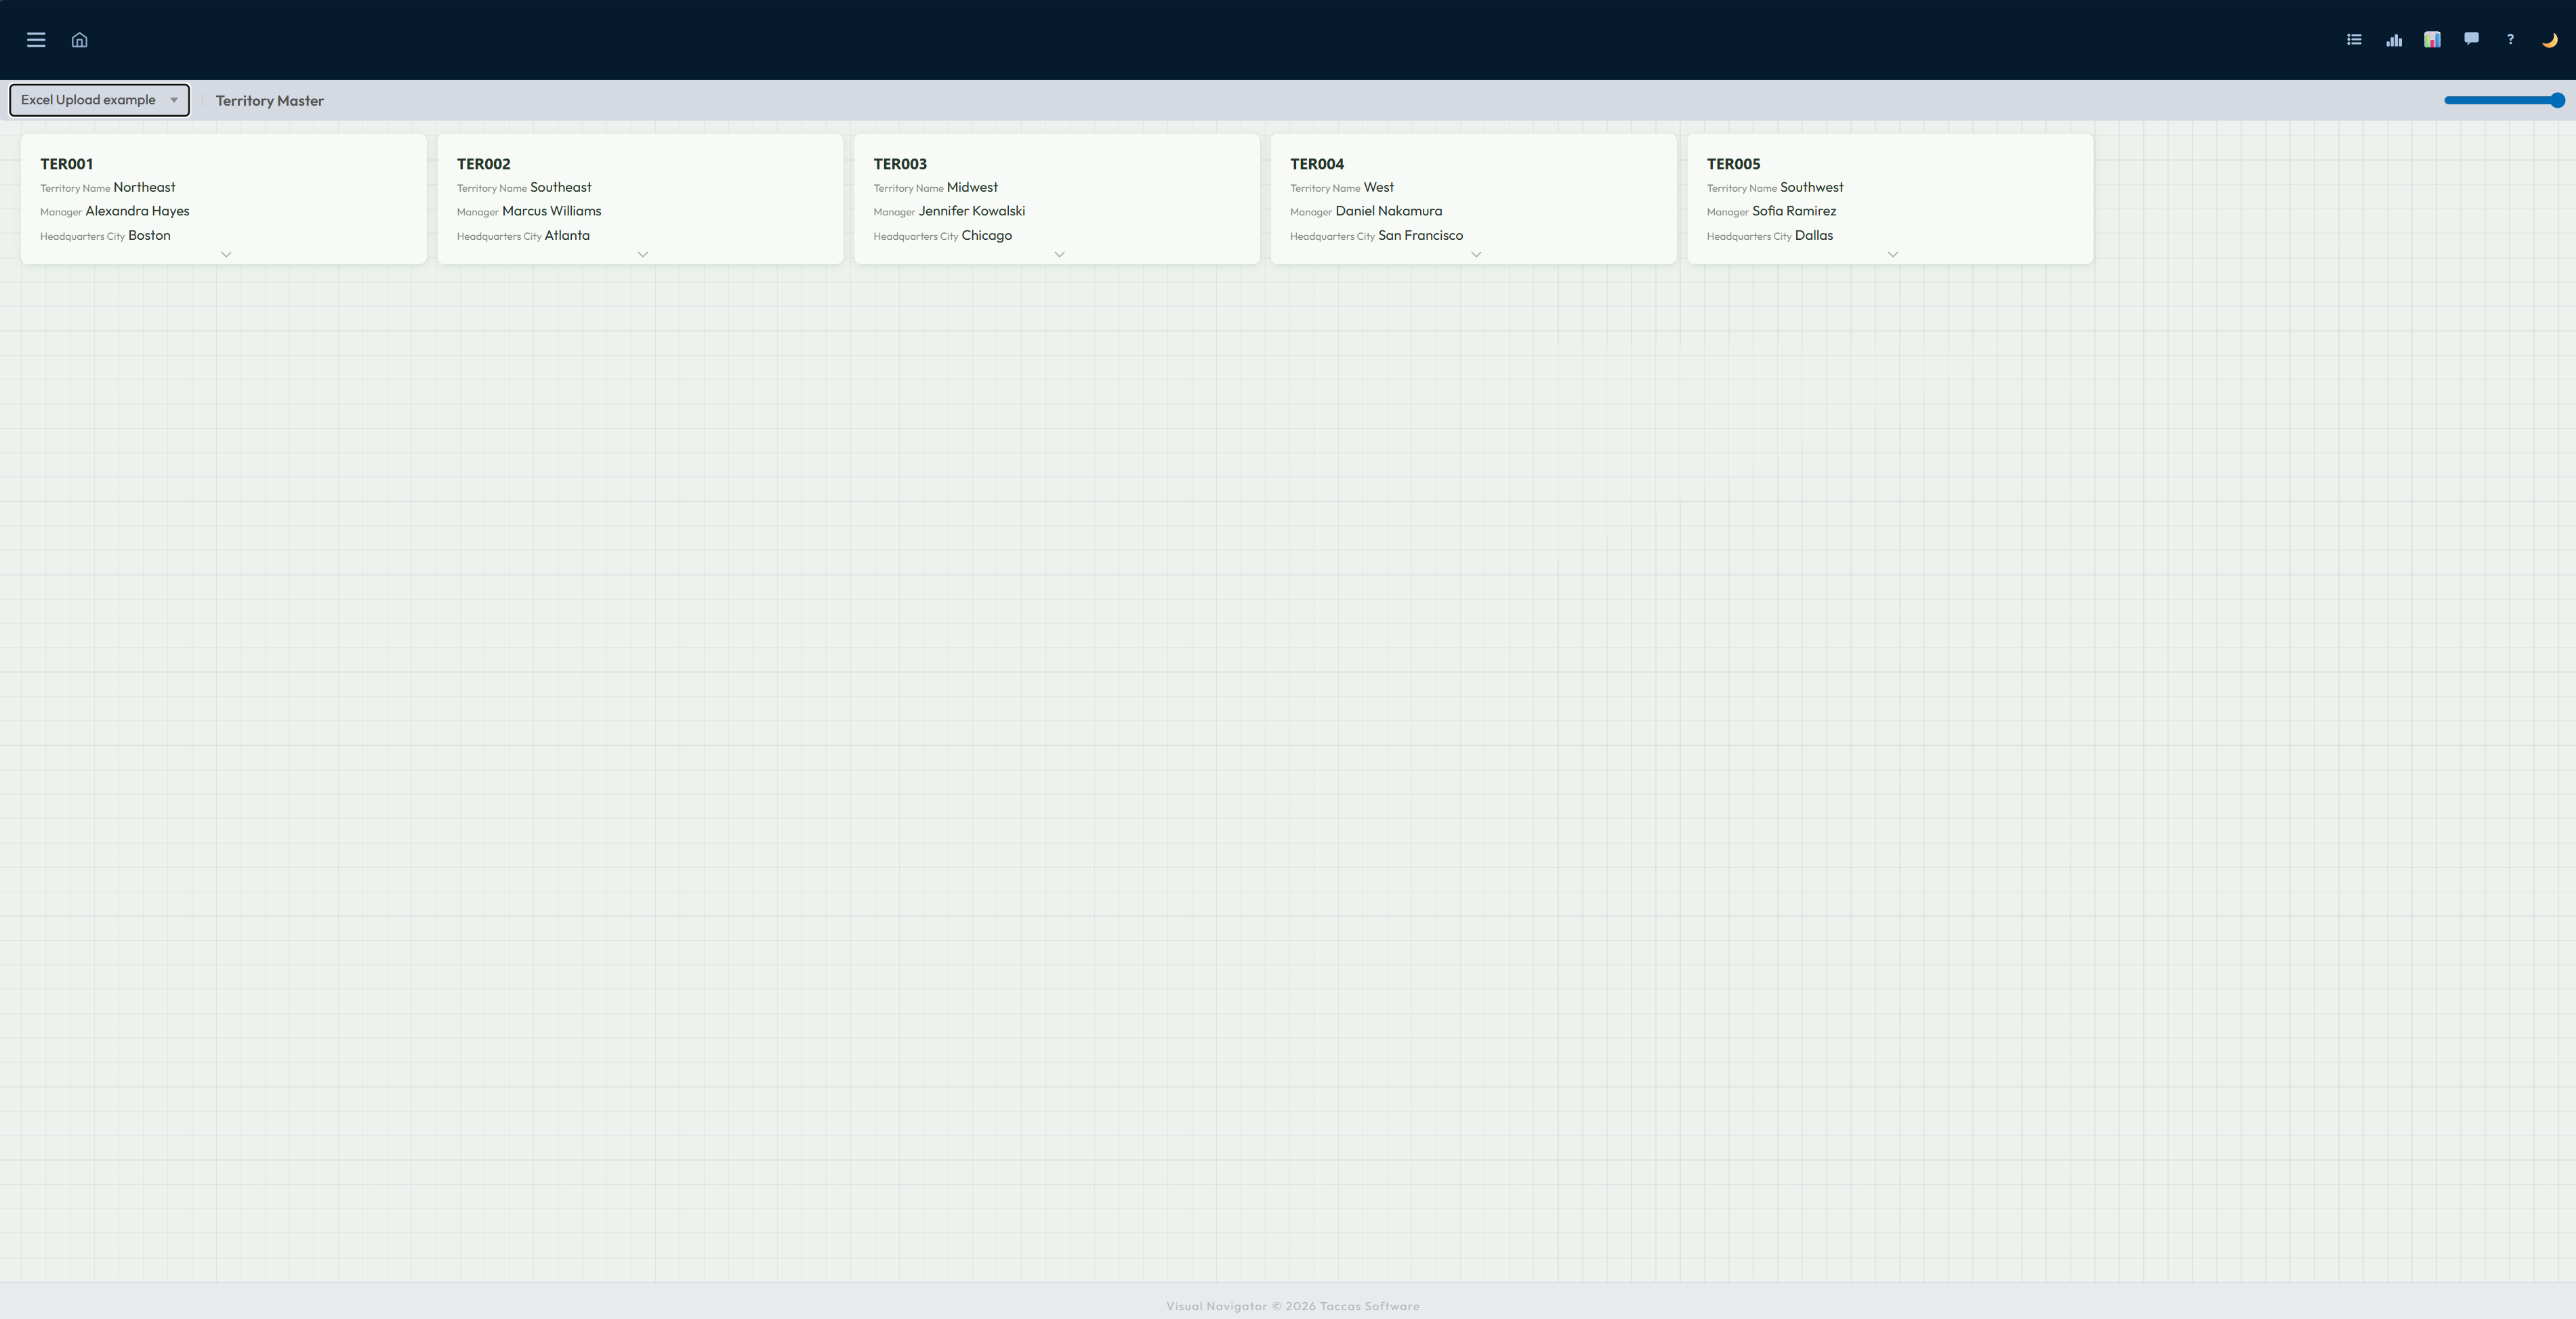
The finished Excel example starts with territories as tiles. Select a territory to open the customers and sales beneath it, while keeping the route back to the higher-level information clear.
Excel records can also be shown in lists, grouped columns and full record pages. People can narrow what they see, mark important records, bring warnings forward, calculate totals and include the information in reports just as they can with database information.