Connect
Connect Navi to SQL Server, Oracle or PostgreSQL, or upload an Excel workbook. Navi reads the data as it is.
Operational intelligence, shaped around your work
Navi takes Excel workbooks or database data and turns them into a visual dashboard built around the way your work is organised.
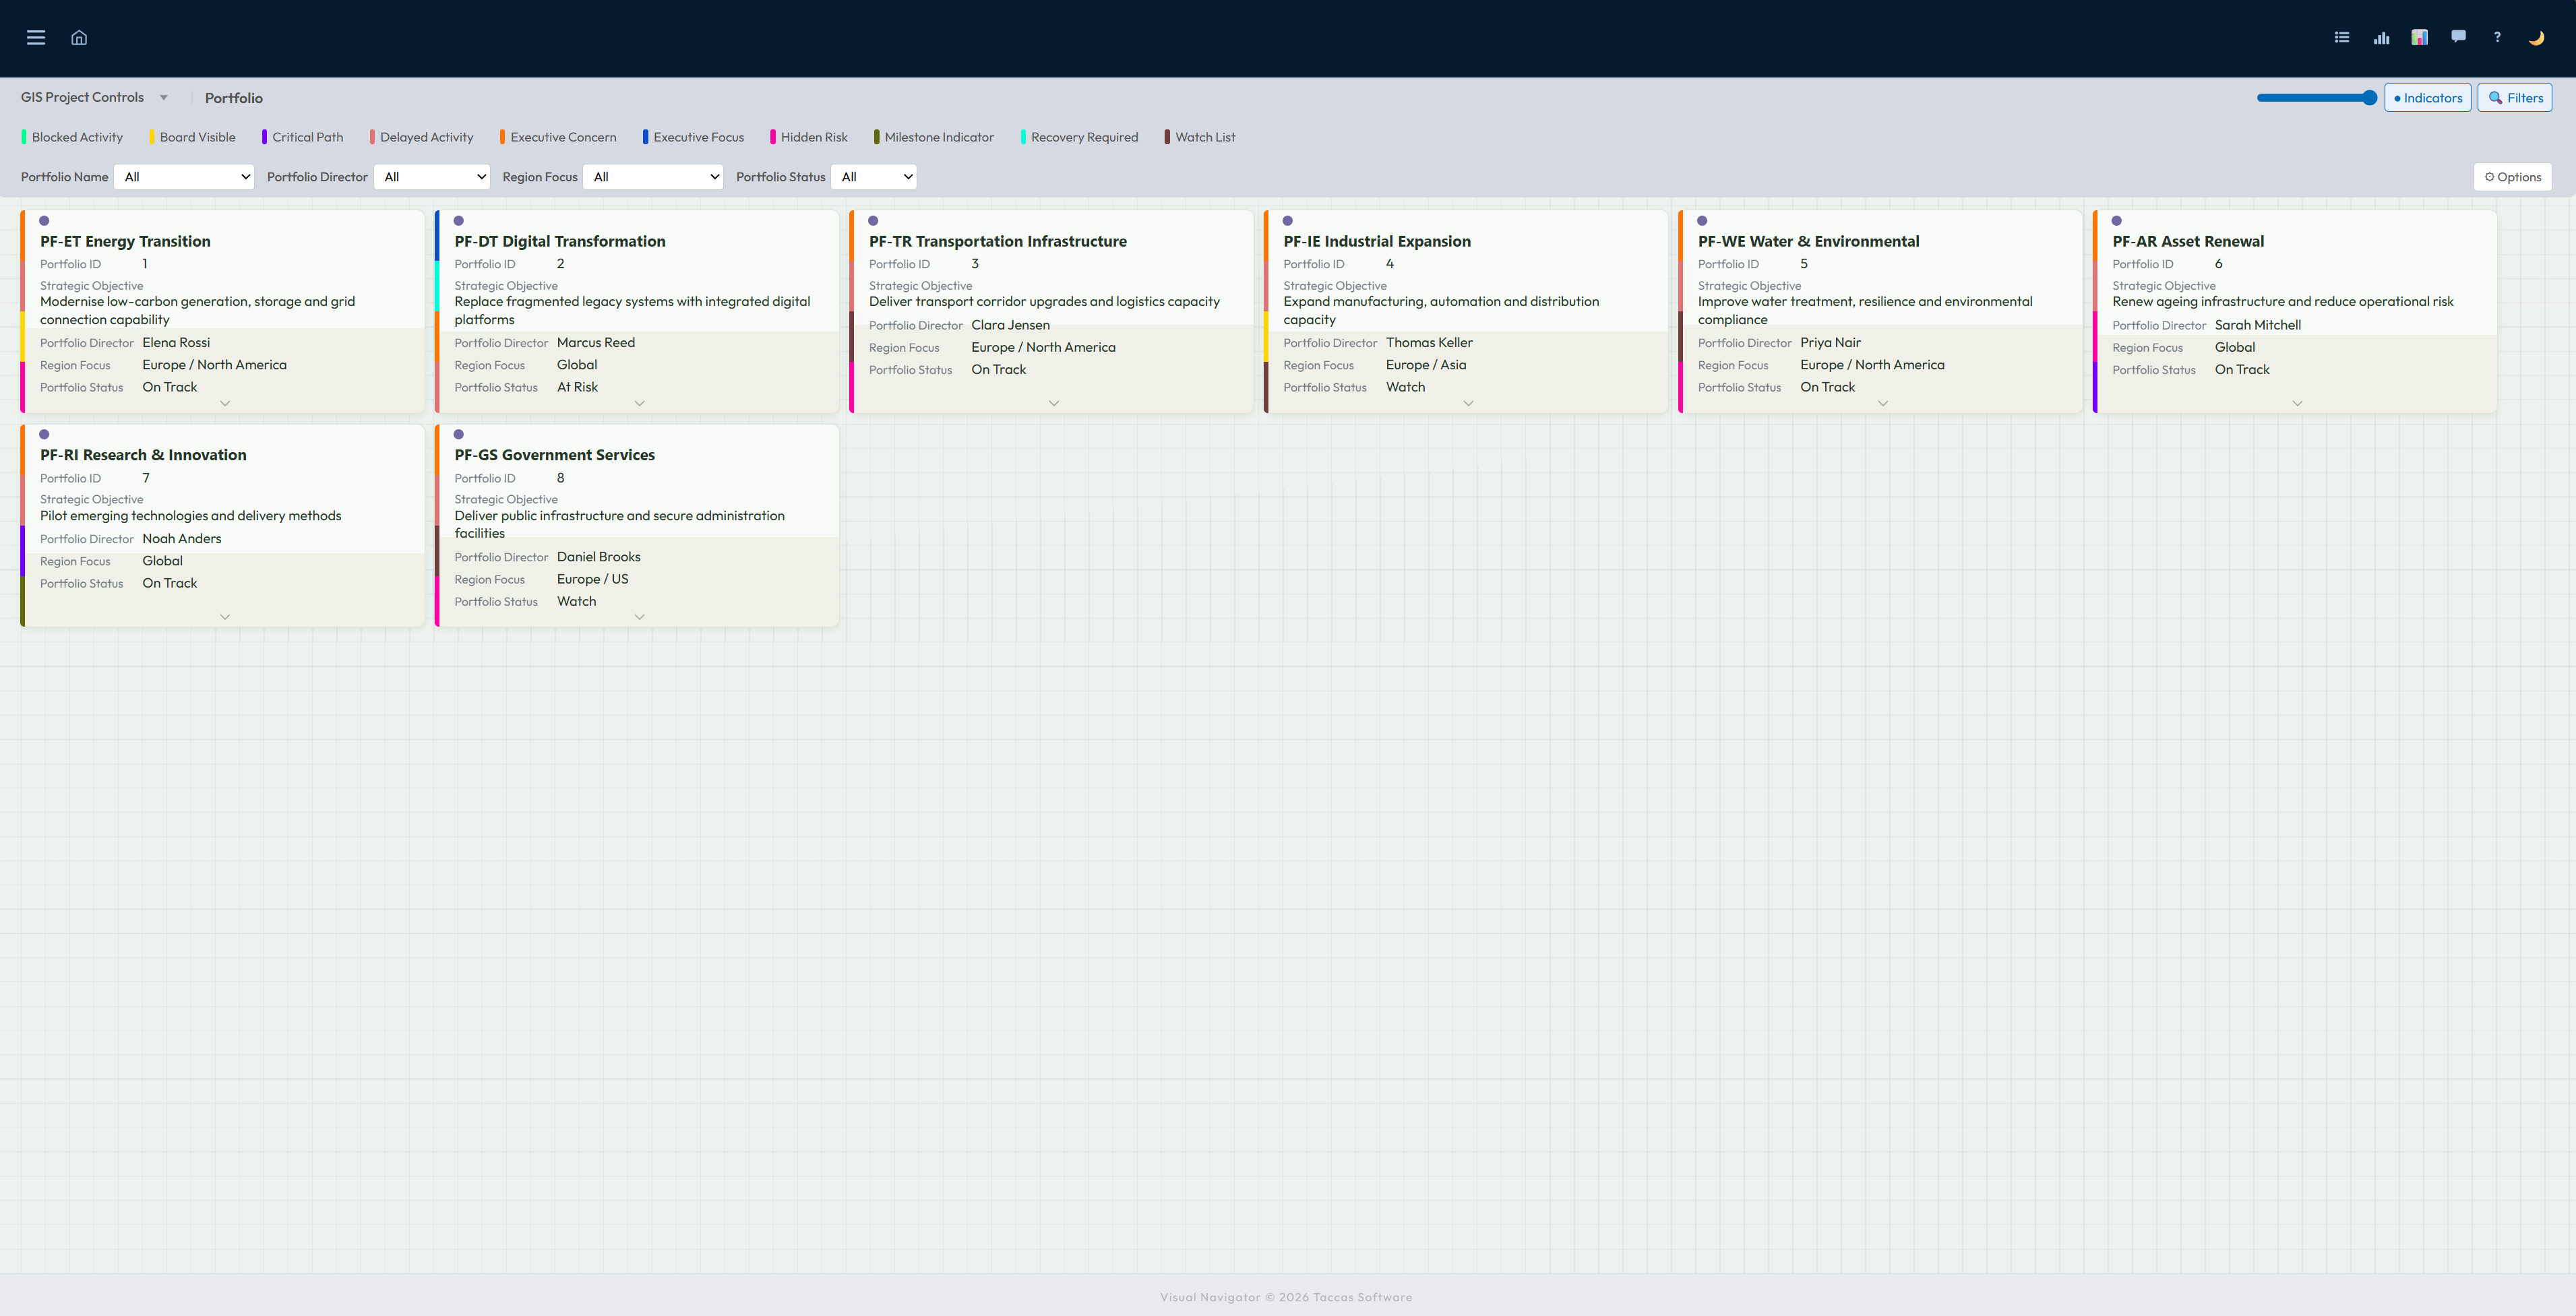
A portfolio view in Navi. Select a tile to move deeper into the work.
Reports show a page. Navi lets people move through the work.
How Navi works
Connect Navi to SQL Server, Oracle or PostgreSQL, or upload an Excel workbook. Navi reads the data as it is.
Navi turns the data into a dashboard that follows the way your information is organised. No coding is needed.
See the dashboard straight away. Select an item to open the groups and individual records behind it, while clear markers bring important work forward.
Navi at a glance
The short version, before we show you the detail.
Build and change dashboards without writing software or waiting for a developer.
Start with the overall picture, then select any item to open the groups and individual records behind it.
Show related groups in clear columns so unusual, missing or isolated records stand out quickly.
People who understand the work can choose the stages, information and page layouts themselves.
Bring important changes forward, compare results, follow trends and produce reports from the same information.
Upload Excel workbooks, connect to a business database and bring compatible information together in one dashboard.
Use information already available to calculate totals, differences and other values the team needs.
Keep a record of uploads and changes, and retain selected values over time for comparison.
Install Navi on a Windows server managed by your organisation, close to the information it uses.
Your information, your structure
Portfolio, programme and project is only one example. Navi does not lock you into those names or that type of work.
A sales team might move from region to customer to opportunity. A maintenance team might use site, asset and work order. Choose the stages from the information you already keep, and choose what people see at each one.
Start with a summary, then open the groups and individual records behind it. Each view shows the information that matters at that point.
Narrow the view to the work you care about. Clear markers and warnings bring changes, delays and other problems forward.
Bring in an Excel workbook or connect Navi to a business database. Your existing names, values and relationships become the dashboard people use.
Tile dashboard
The dashboard presents each record as a tile, with the name and most useful information visible immediately. Coloured markers show important conditions without making people open every record.
Use the controls above the tiles to narrow the view. Select a tile to move into the work beneath it, or pause over one to see useful extra information without leaving the dashboard.

Manhattan View
Manhattan View uses the stages and records already present in your data; it is not limited to portfolios, programmes or project information. It could show customers beneath regions, assets beneath sites, products beneath categories, cases beneath departments, or any other connected information your business keeps.
Each column represents one group from your data, with its related records shown beneath it. Uneven groups, missing records and isolated items stand out clearly. Select any record to continue into the next stage, while the same status markers remain visible.
See a simple example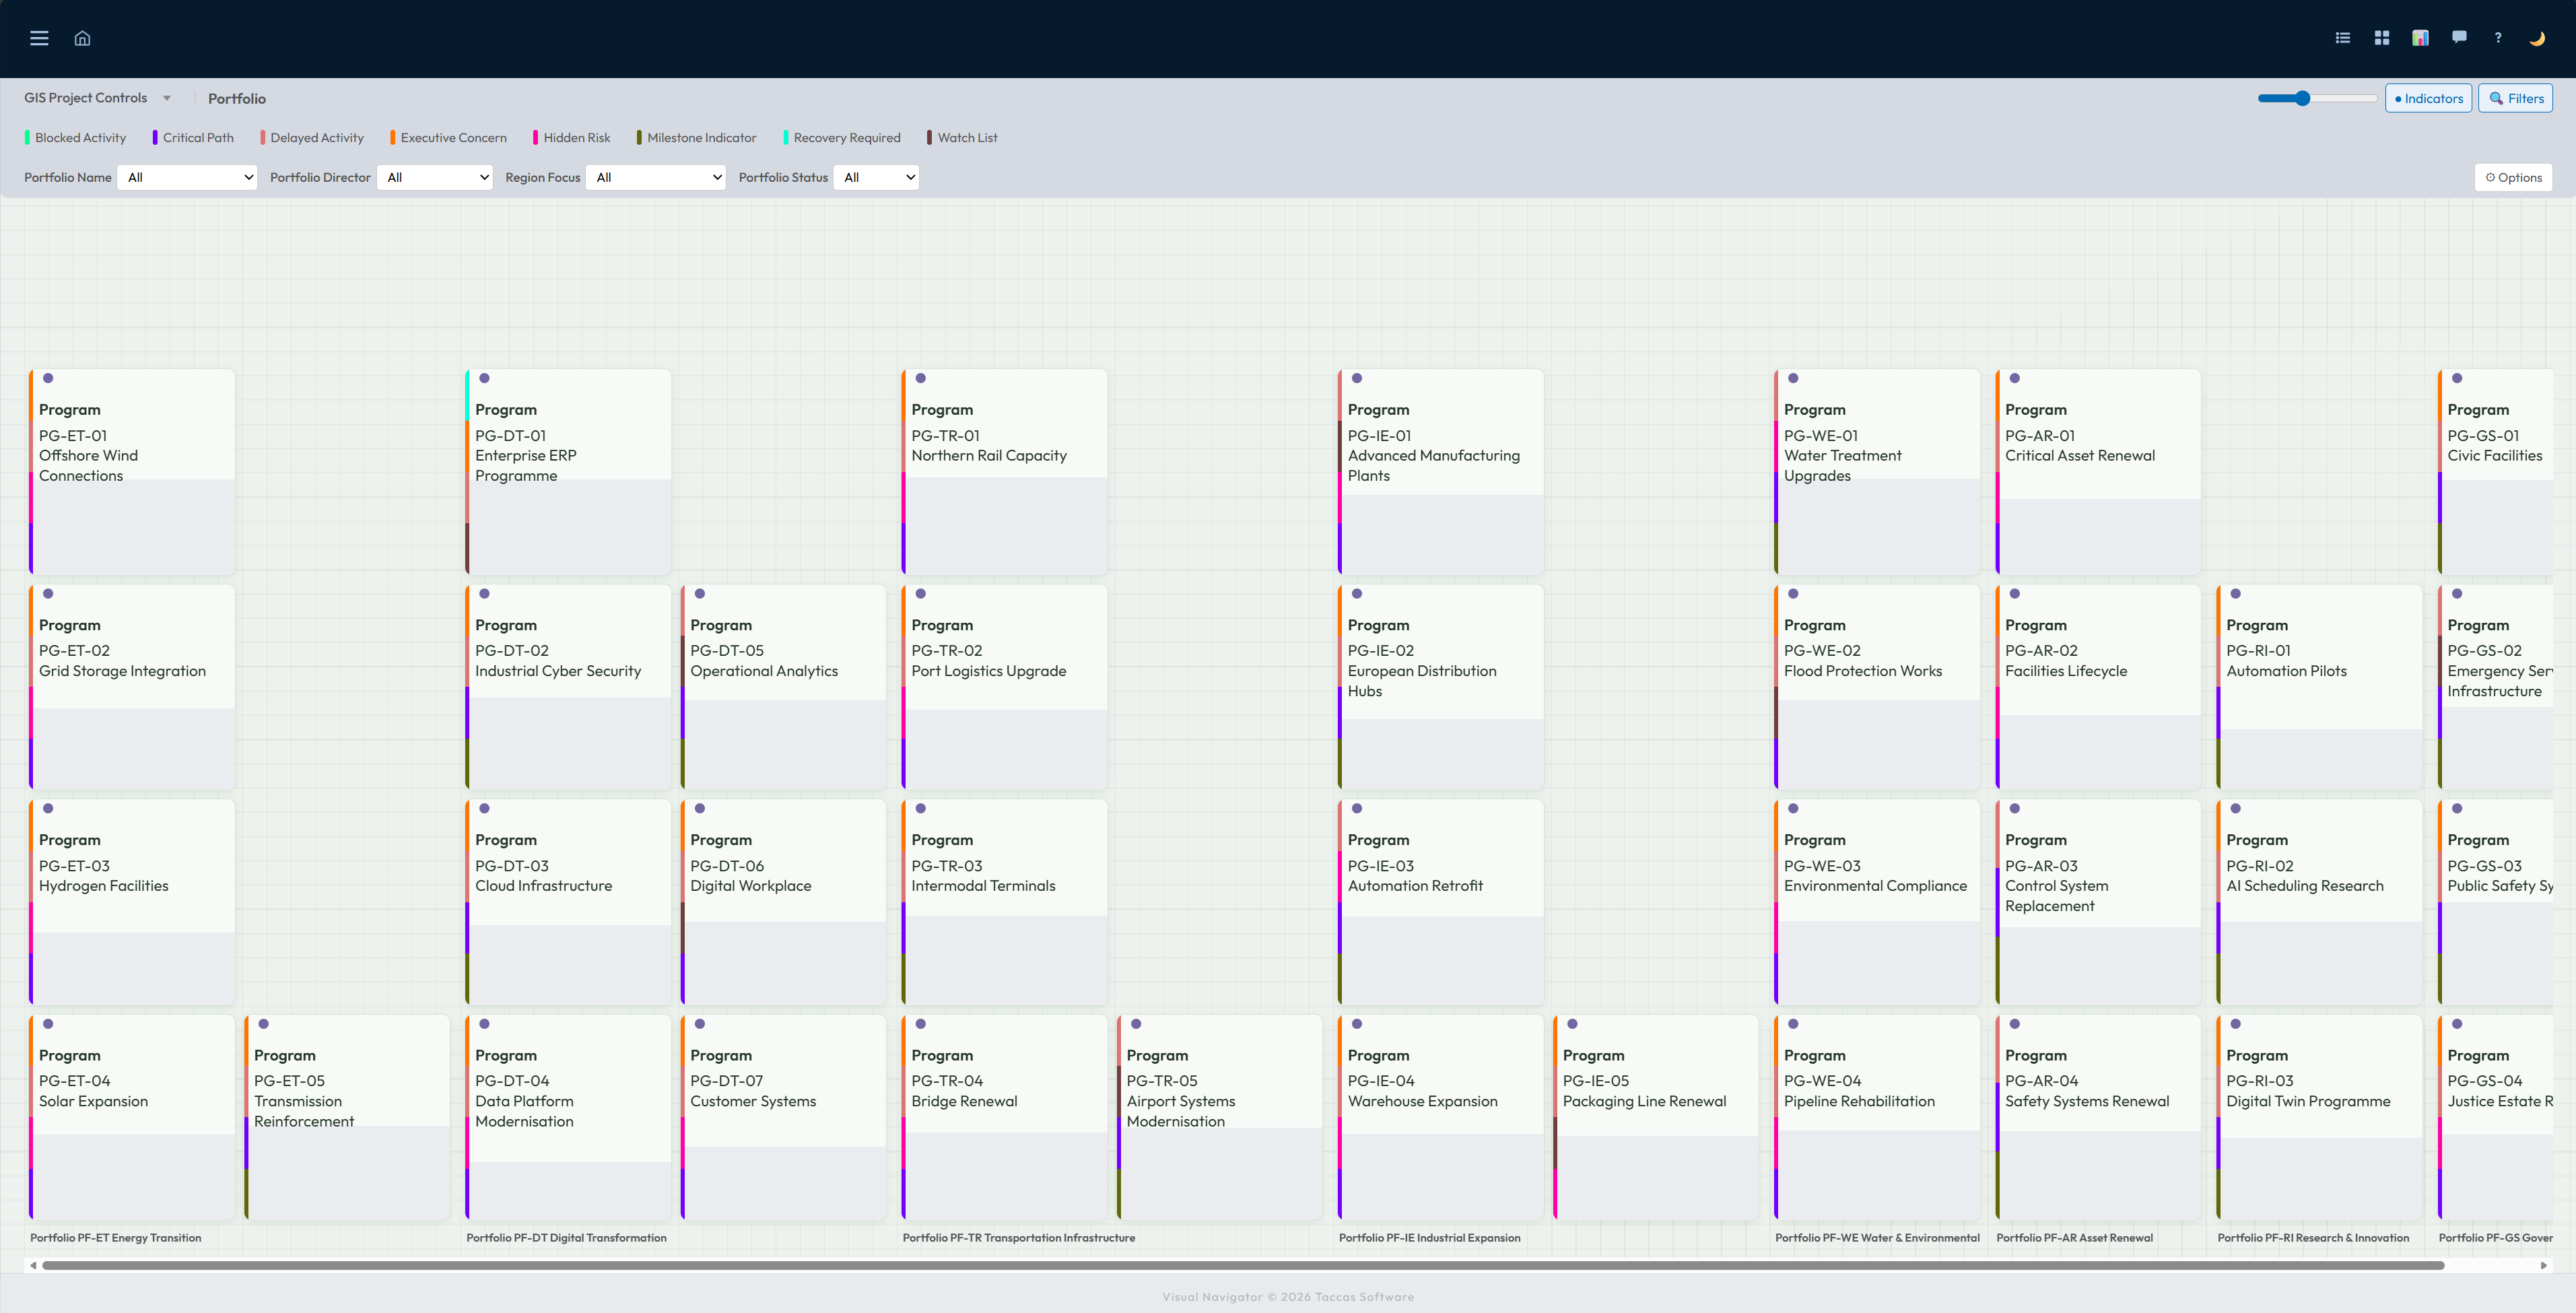
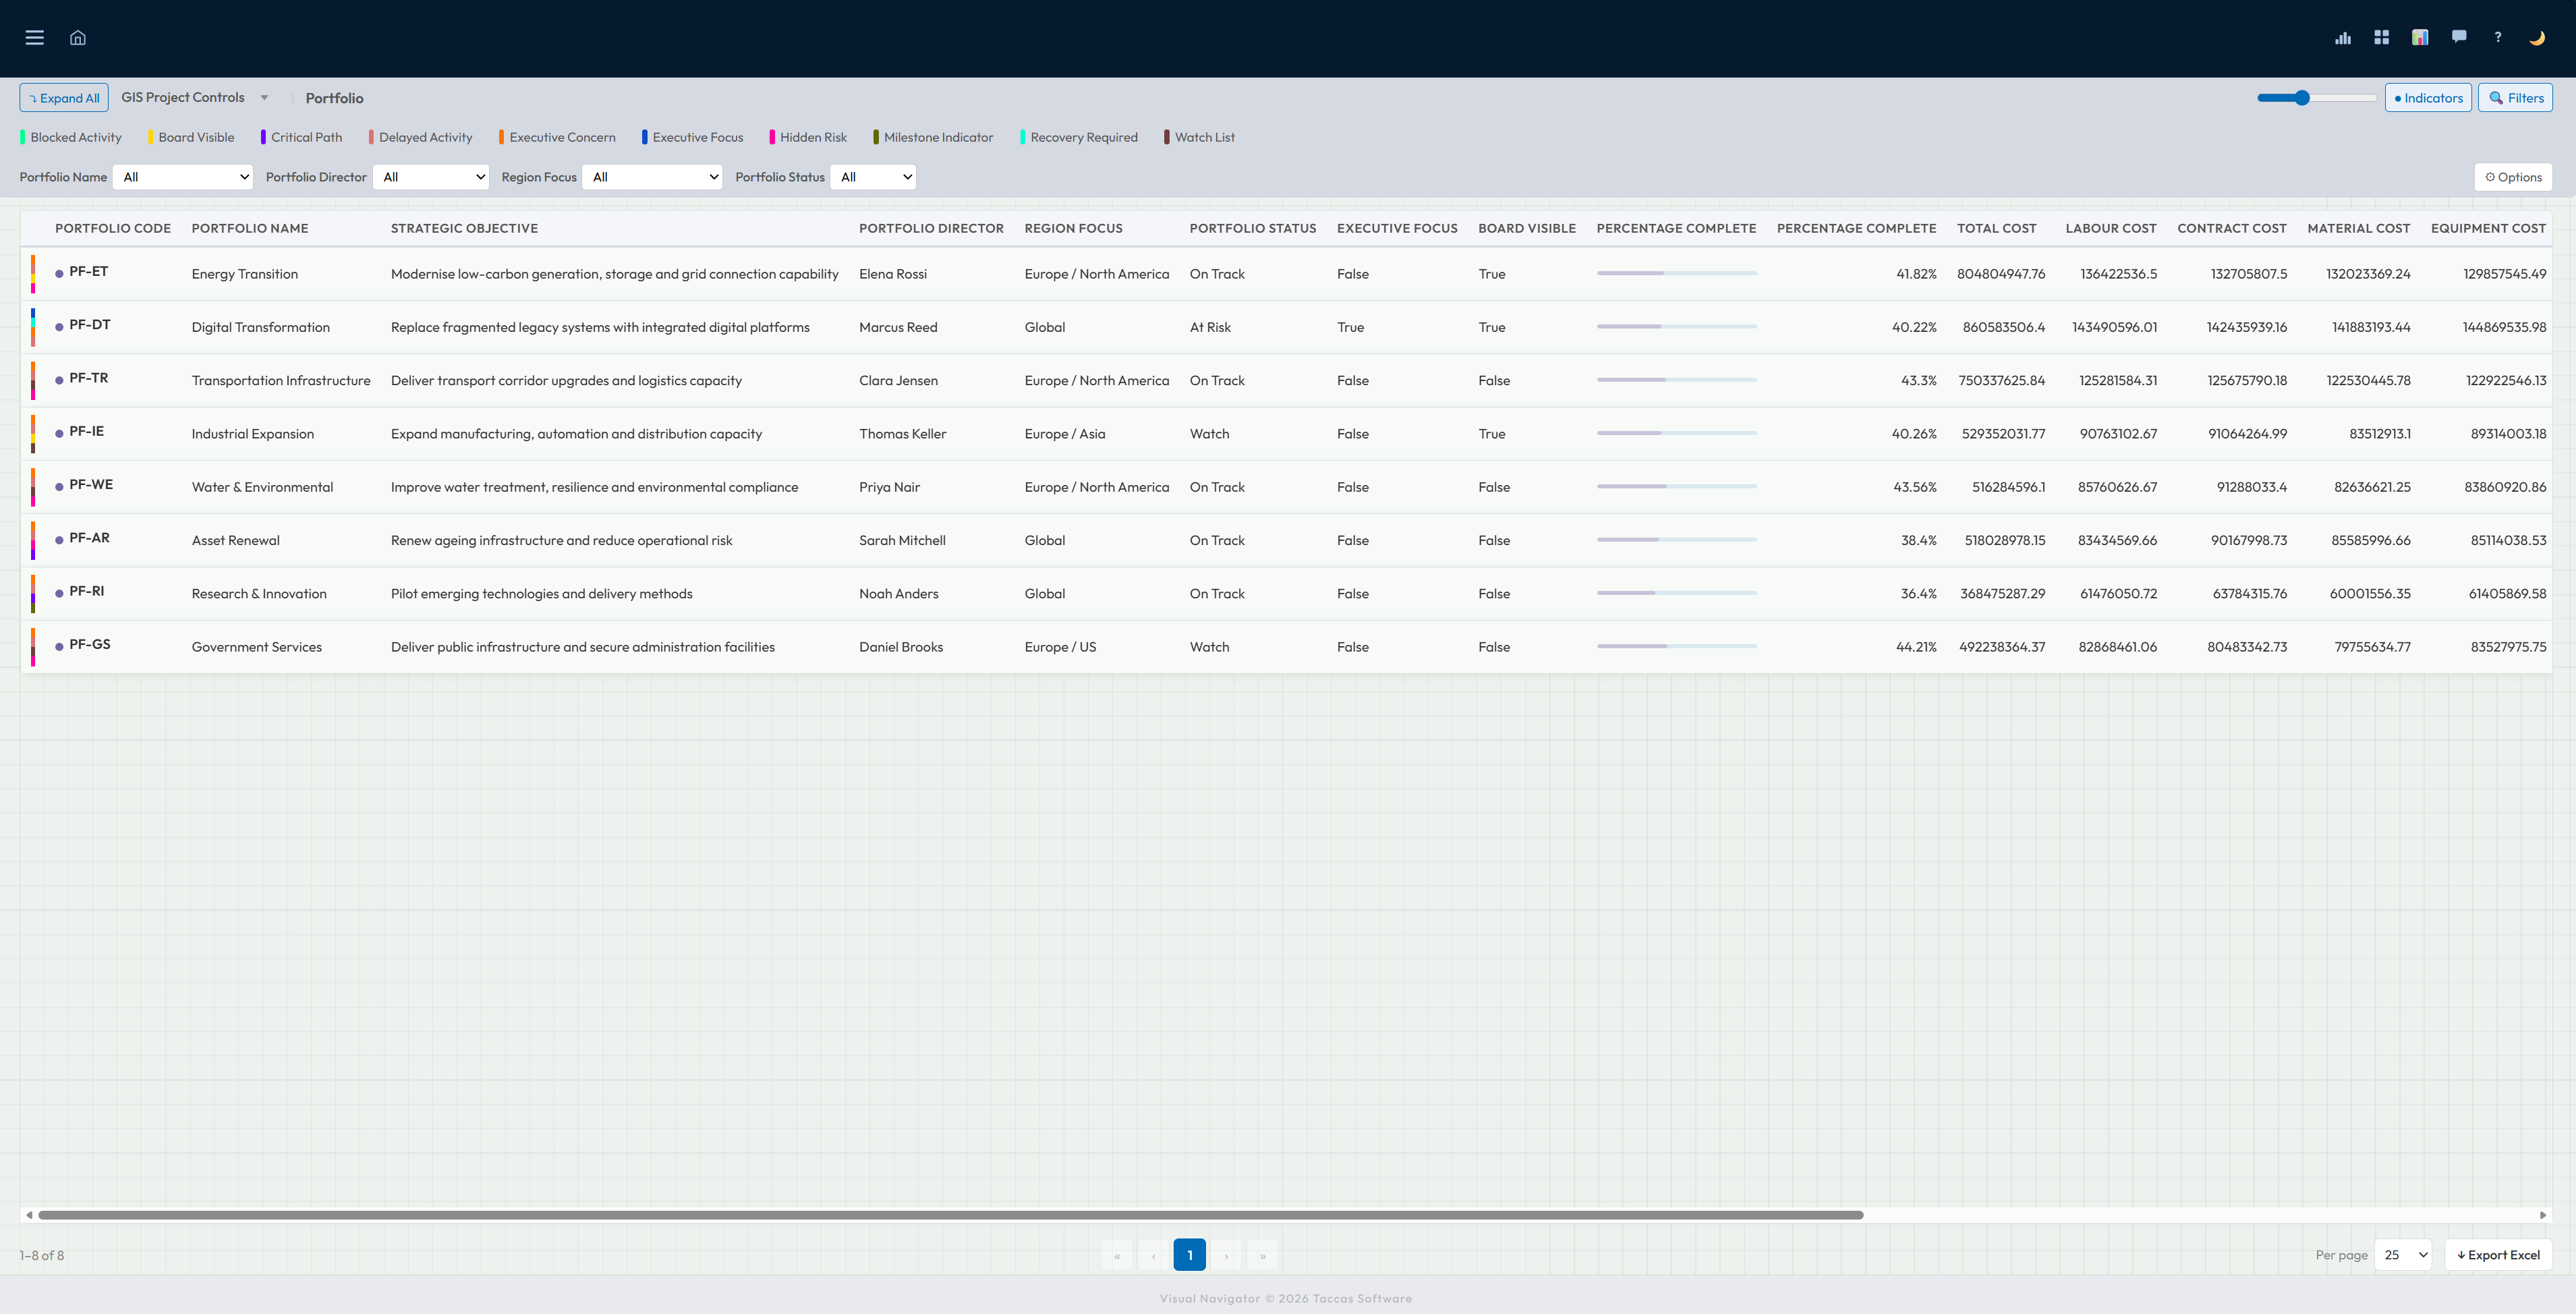
List view
List view places the chosen information into columns so people can compare names, dates, responsibilities, status and values across many records. Status markers remain visible alongside the ordinary business information.
Move across the table when more columns are available, change how many records appear on a page and export the result to Excel when it needs to be reviewed or shared elsewhere.
Built by the people who know the work
Decide the stages people move through, the information they see and how each page is arranged. Set clear rules for totals, warnings and status markers.
No coding is needed. The people who understand the work can shape the dashboard themselves.
See how dashboards are shaped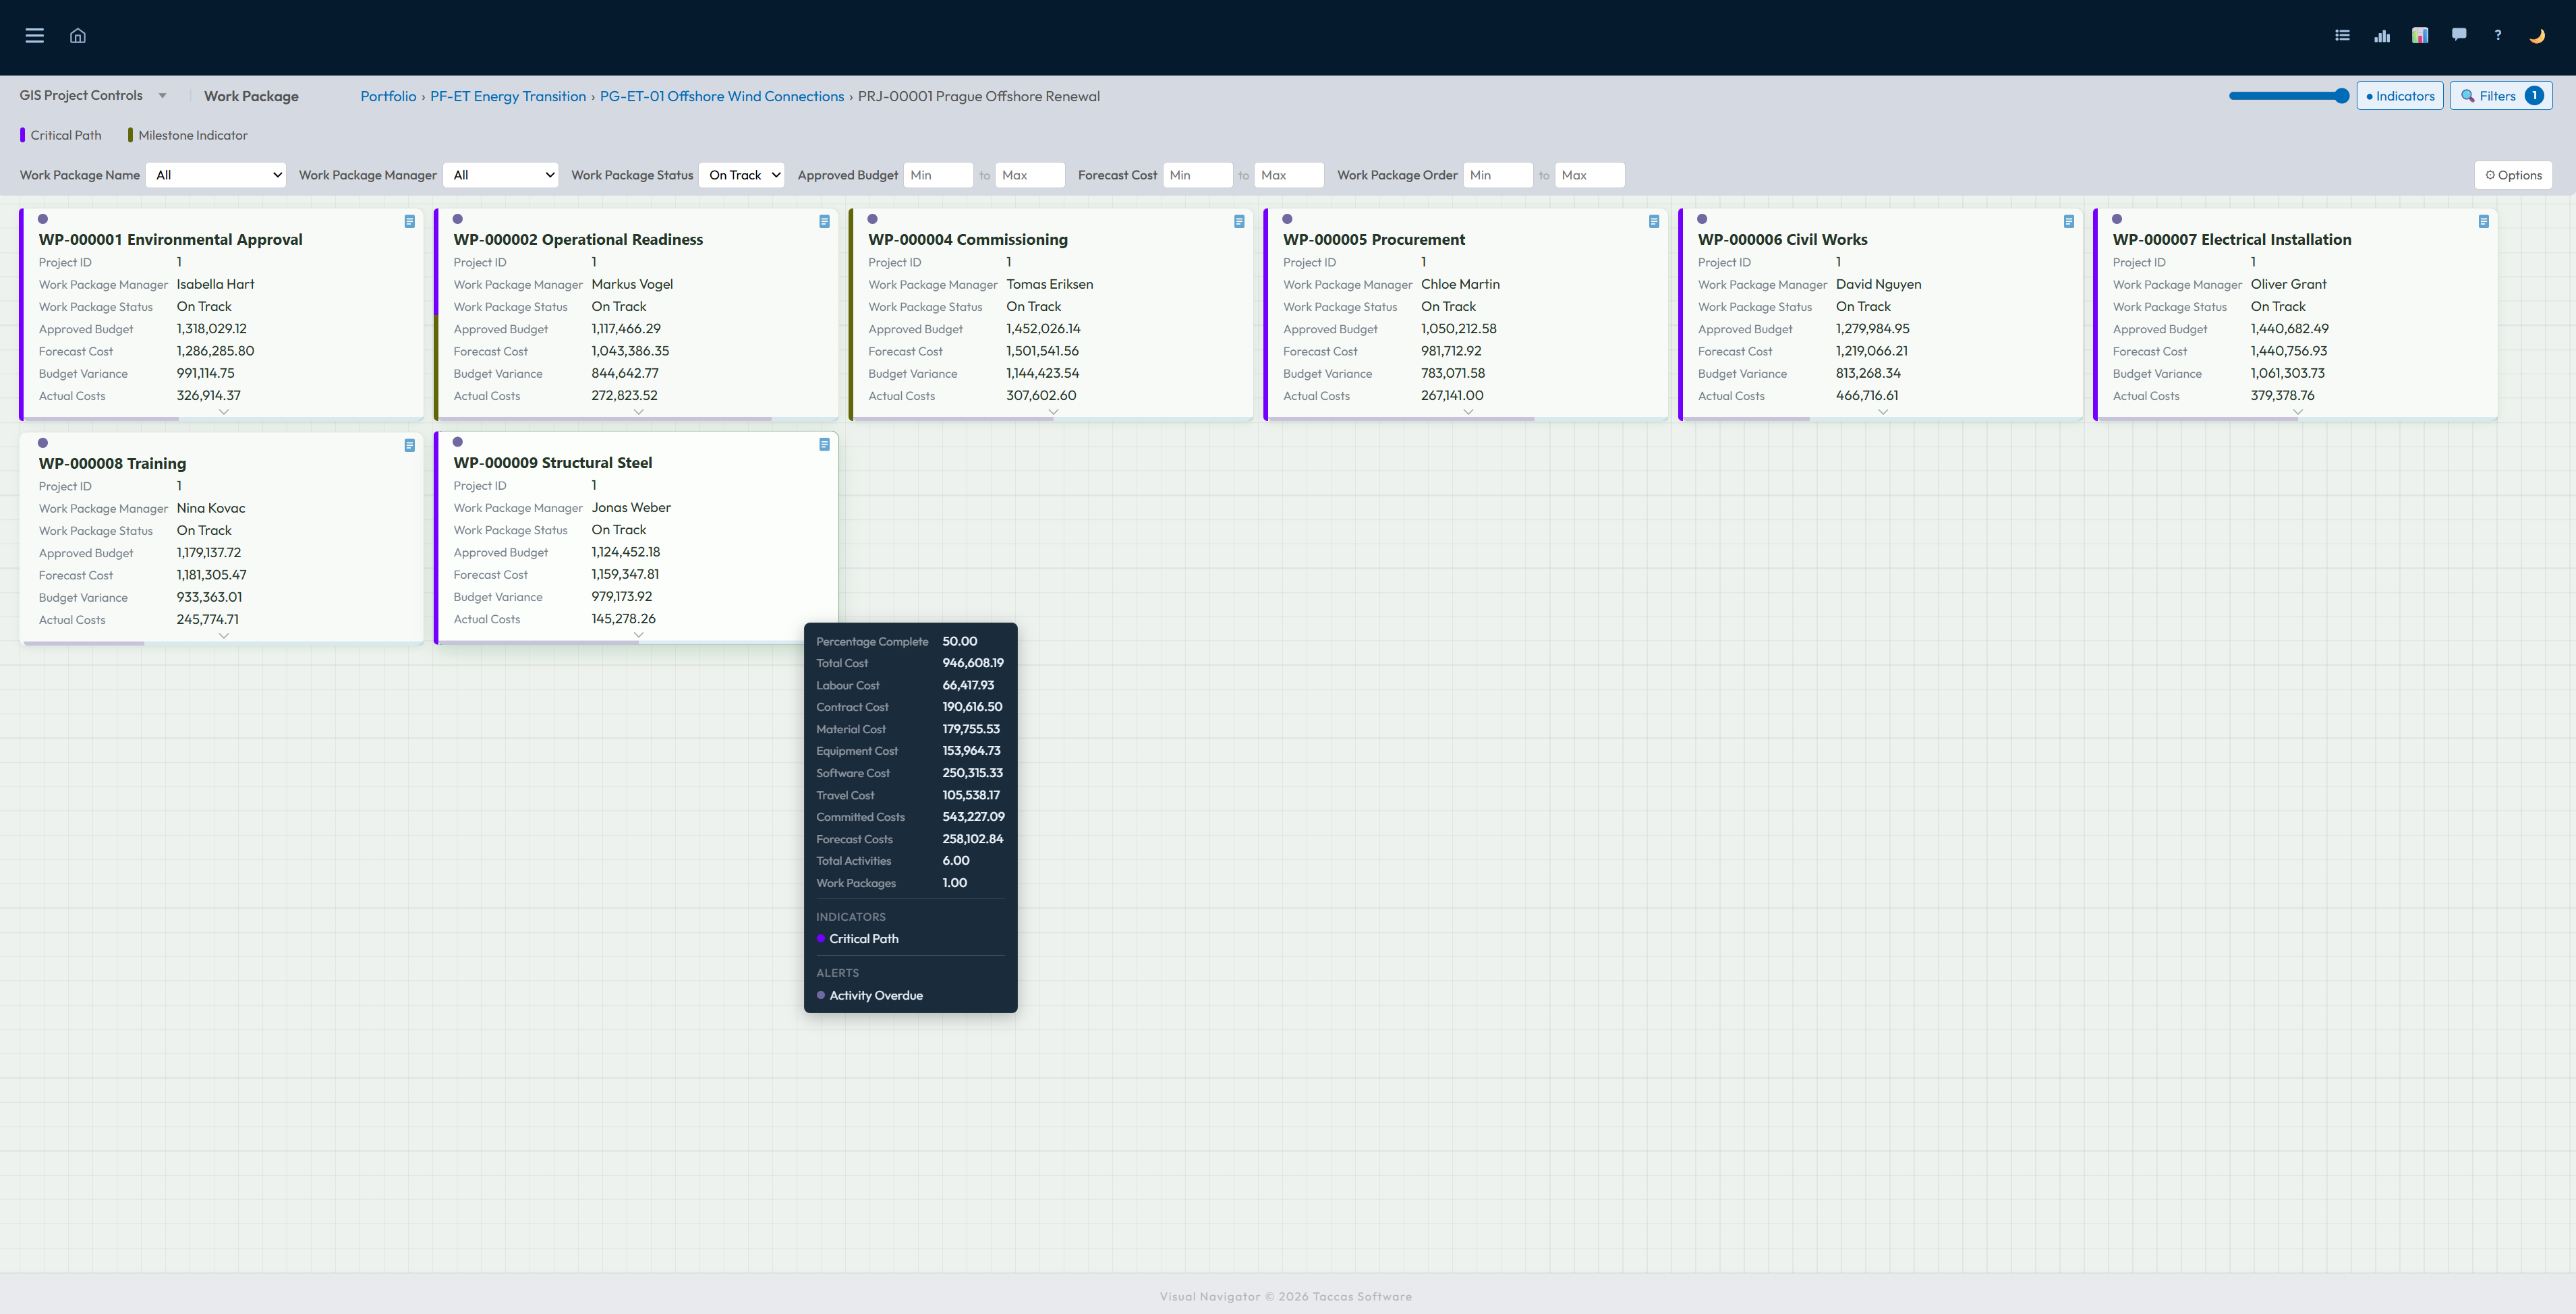
Download the installer and use the full 30-day trial.